
Classification is the most common type of AI task. It is effectively the action or process of classifying something according to its qualities or characteristics.
Examples of classification tasks include:
- Archiving (grouping docs into predefined groups)
- Custom services (dispatching customer inquiries to different workflows)
- Customer profiling (categorizing user preferences, e.g. cuisine, music genres )
- Disease diagnosis (profiling disease based on symptoms)
Often there are only two possible classes something could be predicted for, in this instance the process is called Binary Classification.
Binary Classification is particularly common for:
- Internet fraud detection (identifying fake searches and clicks from real ones)
- Detecting defective products in a production line (whether the product is defective or not)
- Sorting mail as either spam or not spam
- Click-Through Rate Prediction (likelihood that a specific user will click on a specific ad)
Data
A dataset for a classification problem needs two things:
- Any features that are relevant to the classification. The more variables that could affect the classification that is given, the better the classification.
- The data type in the label column must be categorical.
Metrics
We currently support two types of metrics for classification tasks, depending on your needs you must select one of them for your model:
- Accuracy: measures the ratio of correct predictions to the total number of cases evaluated.
- Logloss – takes into account the uncertainty of your prediction based on how much it varies from the actual label.
Accuracy is the most common metric used because it is the easiest to interpret. If your training data has a distribution that is close to reality then using accuracy as your metric would be the best choice. If your training data’s distribution does not represent other real-world data realities then logloss can help you modify your model to give better predictions. If you must evaluate the model for how close it is to the real world, then logloss would be the better metric.
Chatbot Evaluation
The dataset used to create your model was actually split into two, one part was used for training and the other for evaluation. Because of this, it is possible to check the quality of the model without bringing in a separate dataset, the AI will simply use the test data to evaluate itself.
Two useful checks for a binary classification model are:
Precision/Recall
A precision/recall evaluation compares a models precision to its recall, that evaluation is shown in a graph like this:
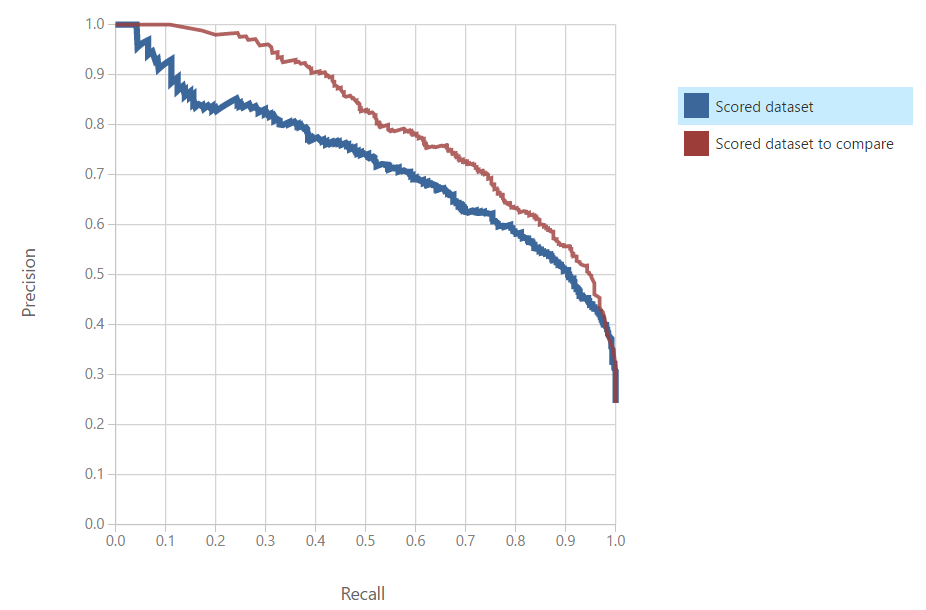
In this graph, the red line is the better model. This is because it maintains a greater precision as the recall goes up. The better model is always the one that has the greater precision to recall curve.
The Command to use this function for Eva is: “@eva precision/recall for (model ID)”
Precision and Recall in Detail
Precision and Recall are determined using the concepts: true/false positives and negatives:
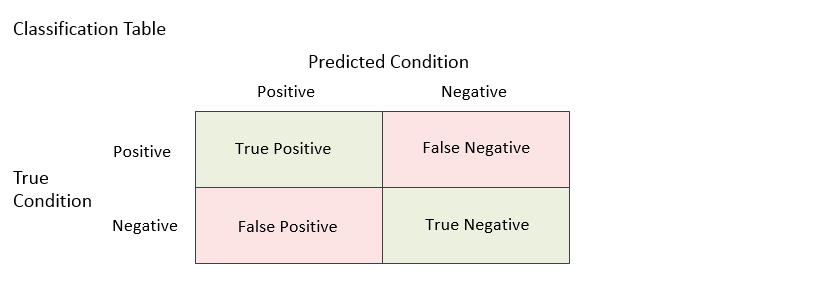
True Positive (tp): The model predicted it was positive and it was.
False Positive (fp): The model predicted it was positive and it was not.
True Negative (tn): The model predicted it was negative and it was.
False Negative (fn): The model predicted it was negative and it was not.
These concepts are used in mathematical formulas to determine the precision and recall of a model:
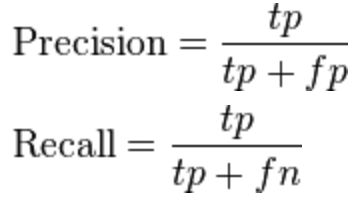
Precision (also called positive predictive value) is the fraction of relevant instances among the retrieved instances. (How many positives that the model says are true are true)
Recall (also known as sensitivity) is the fraction of relevant instances that have been retrieved over the total amount of relevant instances. (How many true positives did the model identify out of how many there are)
Precision and Recall are often both used to determine the quality of a model because they are inversely related. As precision increases, recall falls, and vice versa. This is simply because as a model becomes more precise (picks more correctly) it typically gives out fewer positives,(so as to not be wrong) if a model has greater recall then it gives out more positives, but those will inevitably contain more false positives.
Trade-off between Precision and Recall
The key is to have a model that can be precise at a high level of recall, finding the trade-off between the desired precision and recall helps you pick the best model.
For example:
If out of 50 possible true positives from a total of 100, one model recalls 10, and 9 out of those 10 are true positives, the precision is 90%, but it missed 41 other true positives because it only recalled 10 out of 100. Alternatively, another model recalled 60 out of 100 positives, a great recall, but only 20 out of that 60 were true positives, meaning the precision is only 33%, far too low to be useful. Balance is needed between those two extremes. The best model is one that will recall a significant amount of possible positives and correctly predict which ones are true.
ROC
ROC (Receiver operating characteristic) uses the rates of true positives and false positives to determine a model’s quality. As a graph it looks like this:
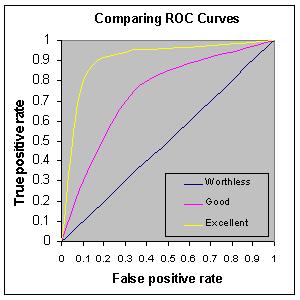
In this graph, the yellow curve is a much better model than the pink curve as it has more true positives than false positives. The best model is the one that keeps a very high true positive rate as the false positive rate increases.
The Command to use this function for Eva is: “@eva ROC for (model ID)”
ROC Detailed
In a ROC curve, the true positive rate is plotted as a function of the false positive rate.
Effectively, the model will be tested to see how often what the model reports as positive is true and how often what the model reports as positive is false.
If your model has a curve that falls to the left of the graph then it is a high-quality model as it has more true positives than false positives. If it falls on the right side of the graph then it has more false positives than true positives and should not be used.