
Step 1 - Data Preparation
Download the data set here.
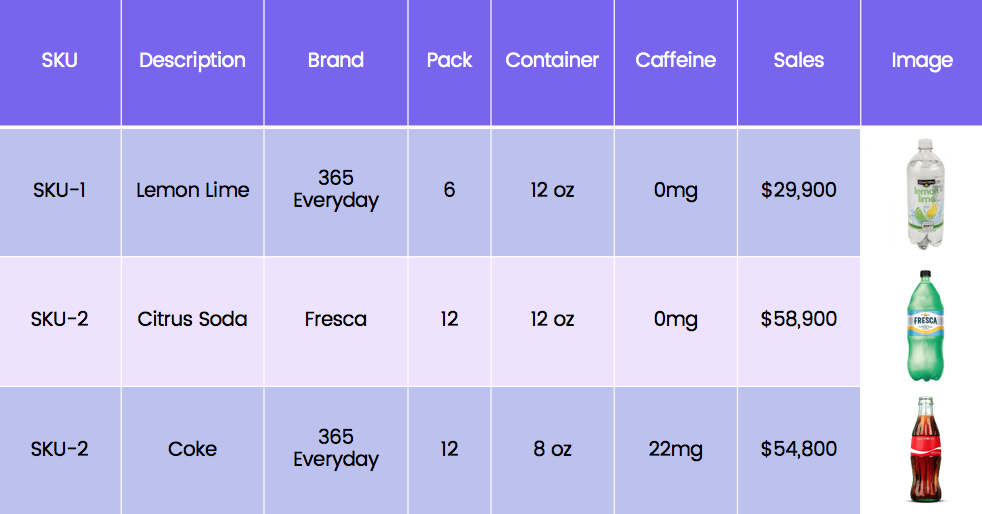
The basic data for forecasting is historical sales records. As long as you provide the three fields of date, product, and sales, you can forecast the future sales. In practice, we recommend collecting all information that affects sales such as transactions, product attributes, store attributes, promotions, pricing, marketing campaigns from ERP, CRM and marketing platforms. 2+ years data is recommended.
What is great about OneClick.ai platform is its ability to handle both structured and unstructured data: numerics, text, images, multi-sequence, and any mixture of them.
There are 11 files in the above link. You can use store_sales_daily_historical.csv to predict the sales of the next 7 days (from 7/21/2015 to 7/27/2015) and other files to verify the forecast performance and treat as inputs for the future continuous forecasts.
Download the data set here.
The basic data for forecasting is historical sales records. As long as you provide the three fields of date, product, and sales, you can forecast the future sales. In practice, we recommend collecting all information that affects sales such as transactions, product attributes, store attributes, promotions, pricing, marketing campaigns from ERP, CRM and marketing platforms. 2+ years data is recommended.
What is great about OneClick.ai platform is its ability to handle both structured and unstructured data: numerics, text, images, multi-sequence, and any mixture of them.
There are 11 files in the above link. You can use store_sales_daily_historical.csv to predict the sales of the next 7 days (from 7/21/2015 to 7/27/2015) and other files to verify the forecast performance and treat as inputs for the future continuous forecasts.
Step 2 - Connect to Data Sources
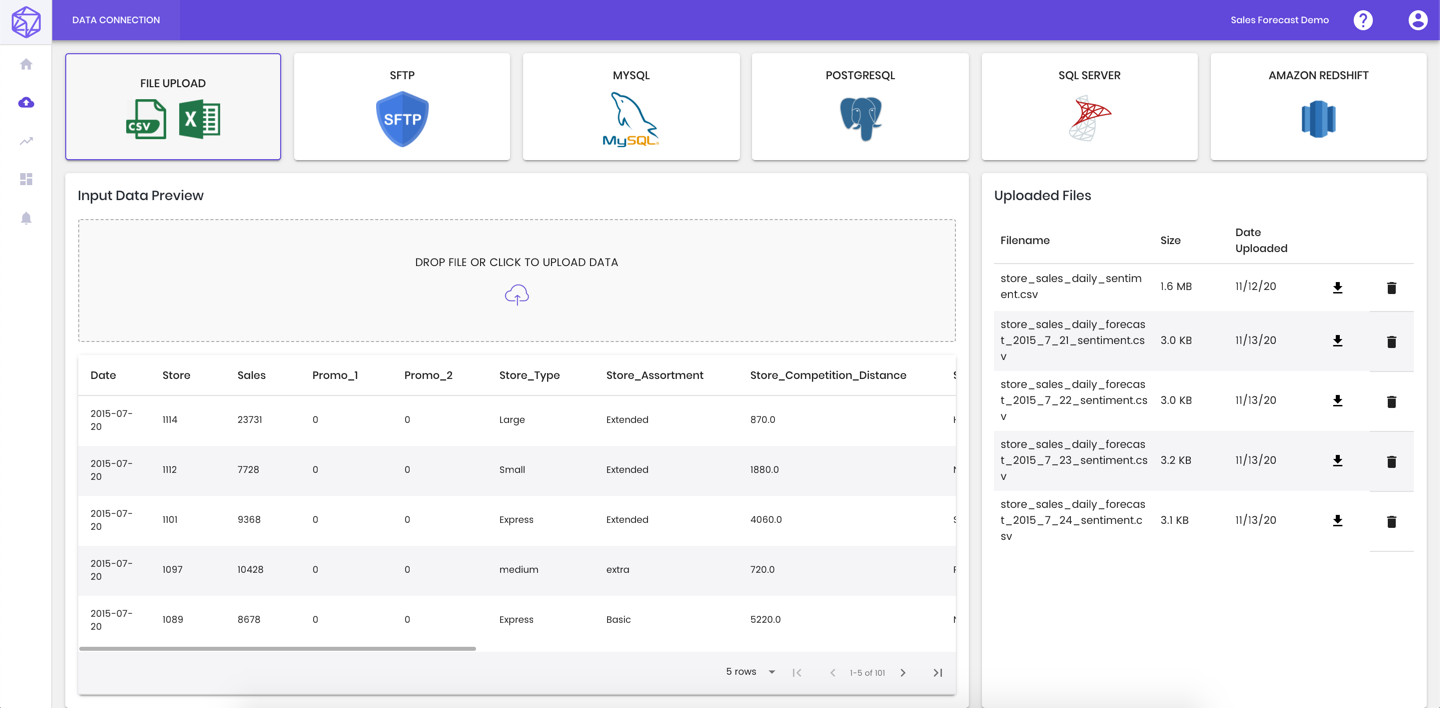
You can choose to upload CSV/Excel directly or setup other connections.
You can choose to upload CSV/Excel directly or setup other connections.
Step 3 - Setup Data Hierarchy
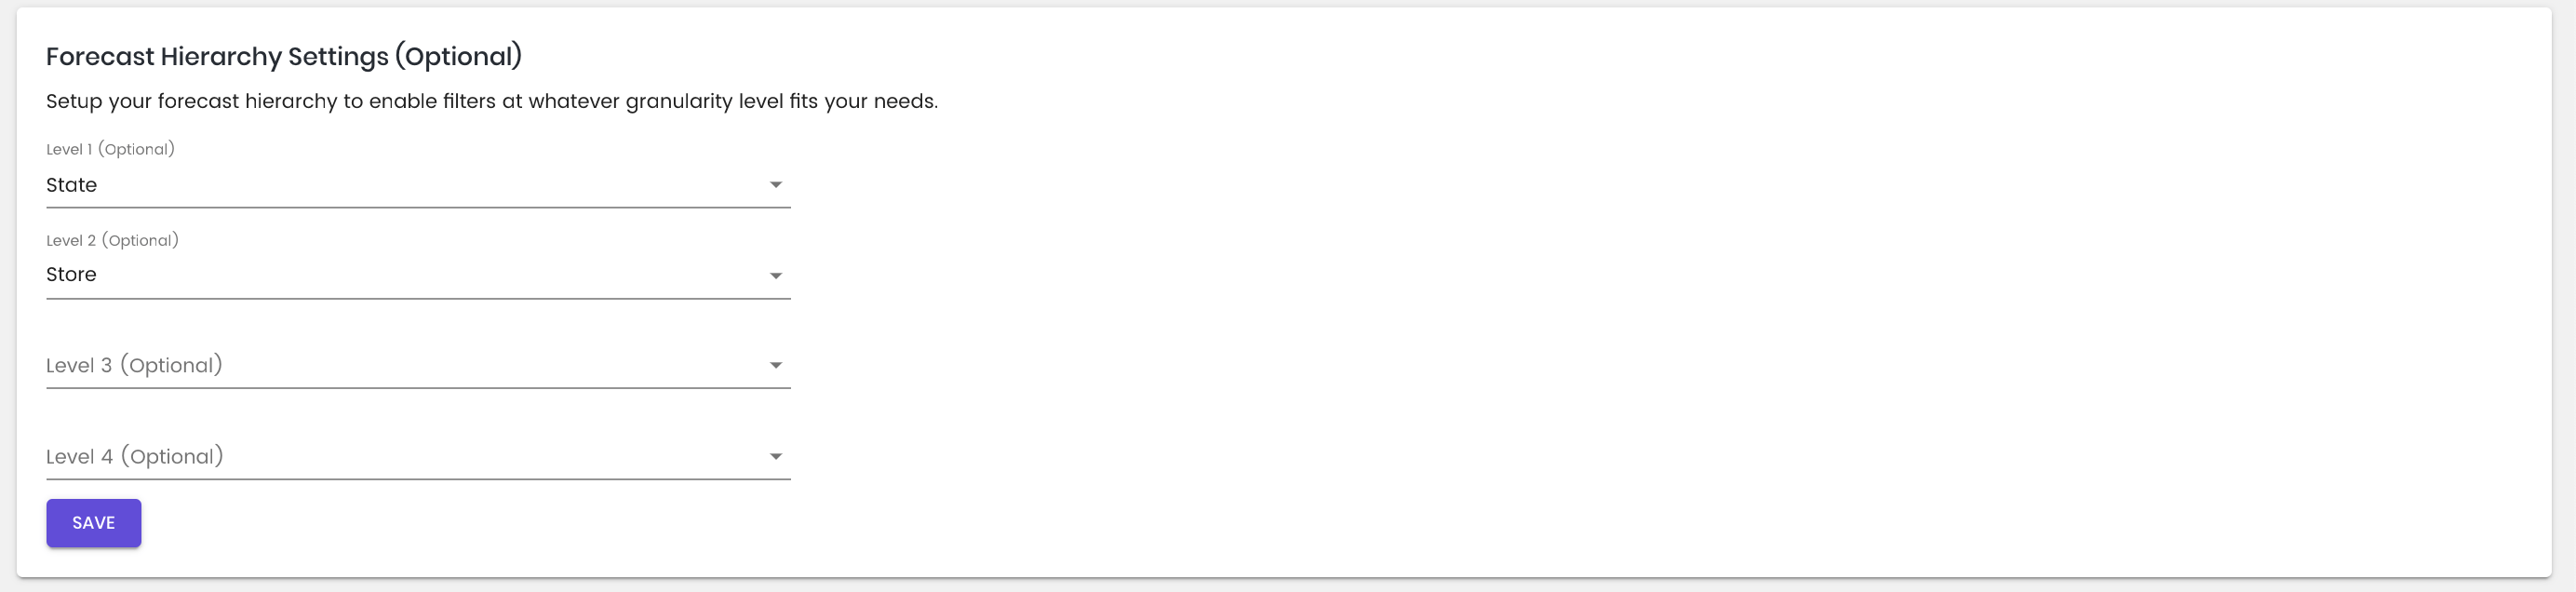
In order to facilitate data visualization later, it is recommended to define the hierarchical relationship within the data. In this example, the states are at the highest level, which is followed by store type and store.
In order to facilitate data visualization later, it is recommended to define the hierarchical relationship within the data. In this example, the states are at the highest level, which is followed by store type and store.
Step 4 - Submit Forecast Task
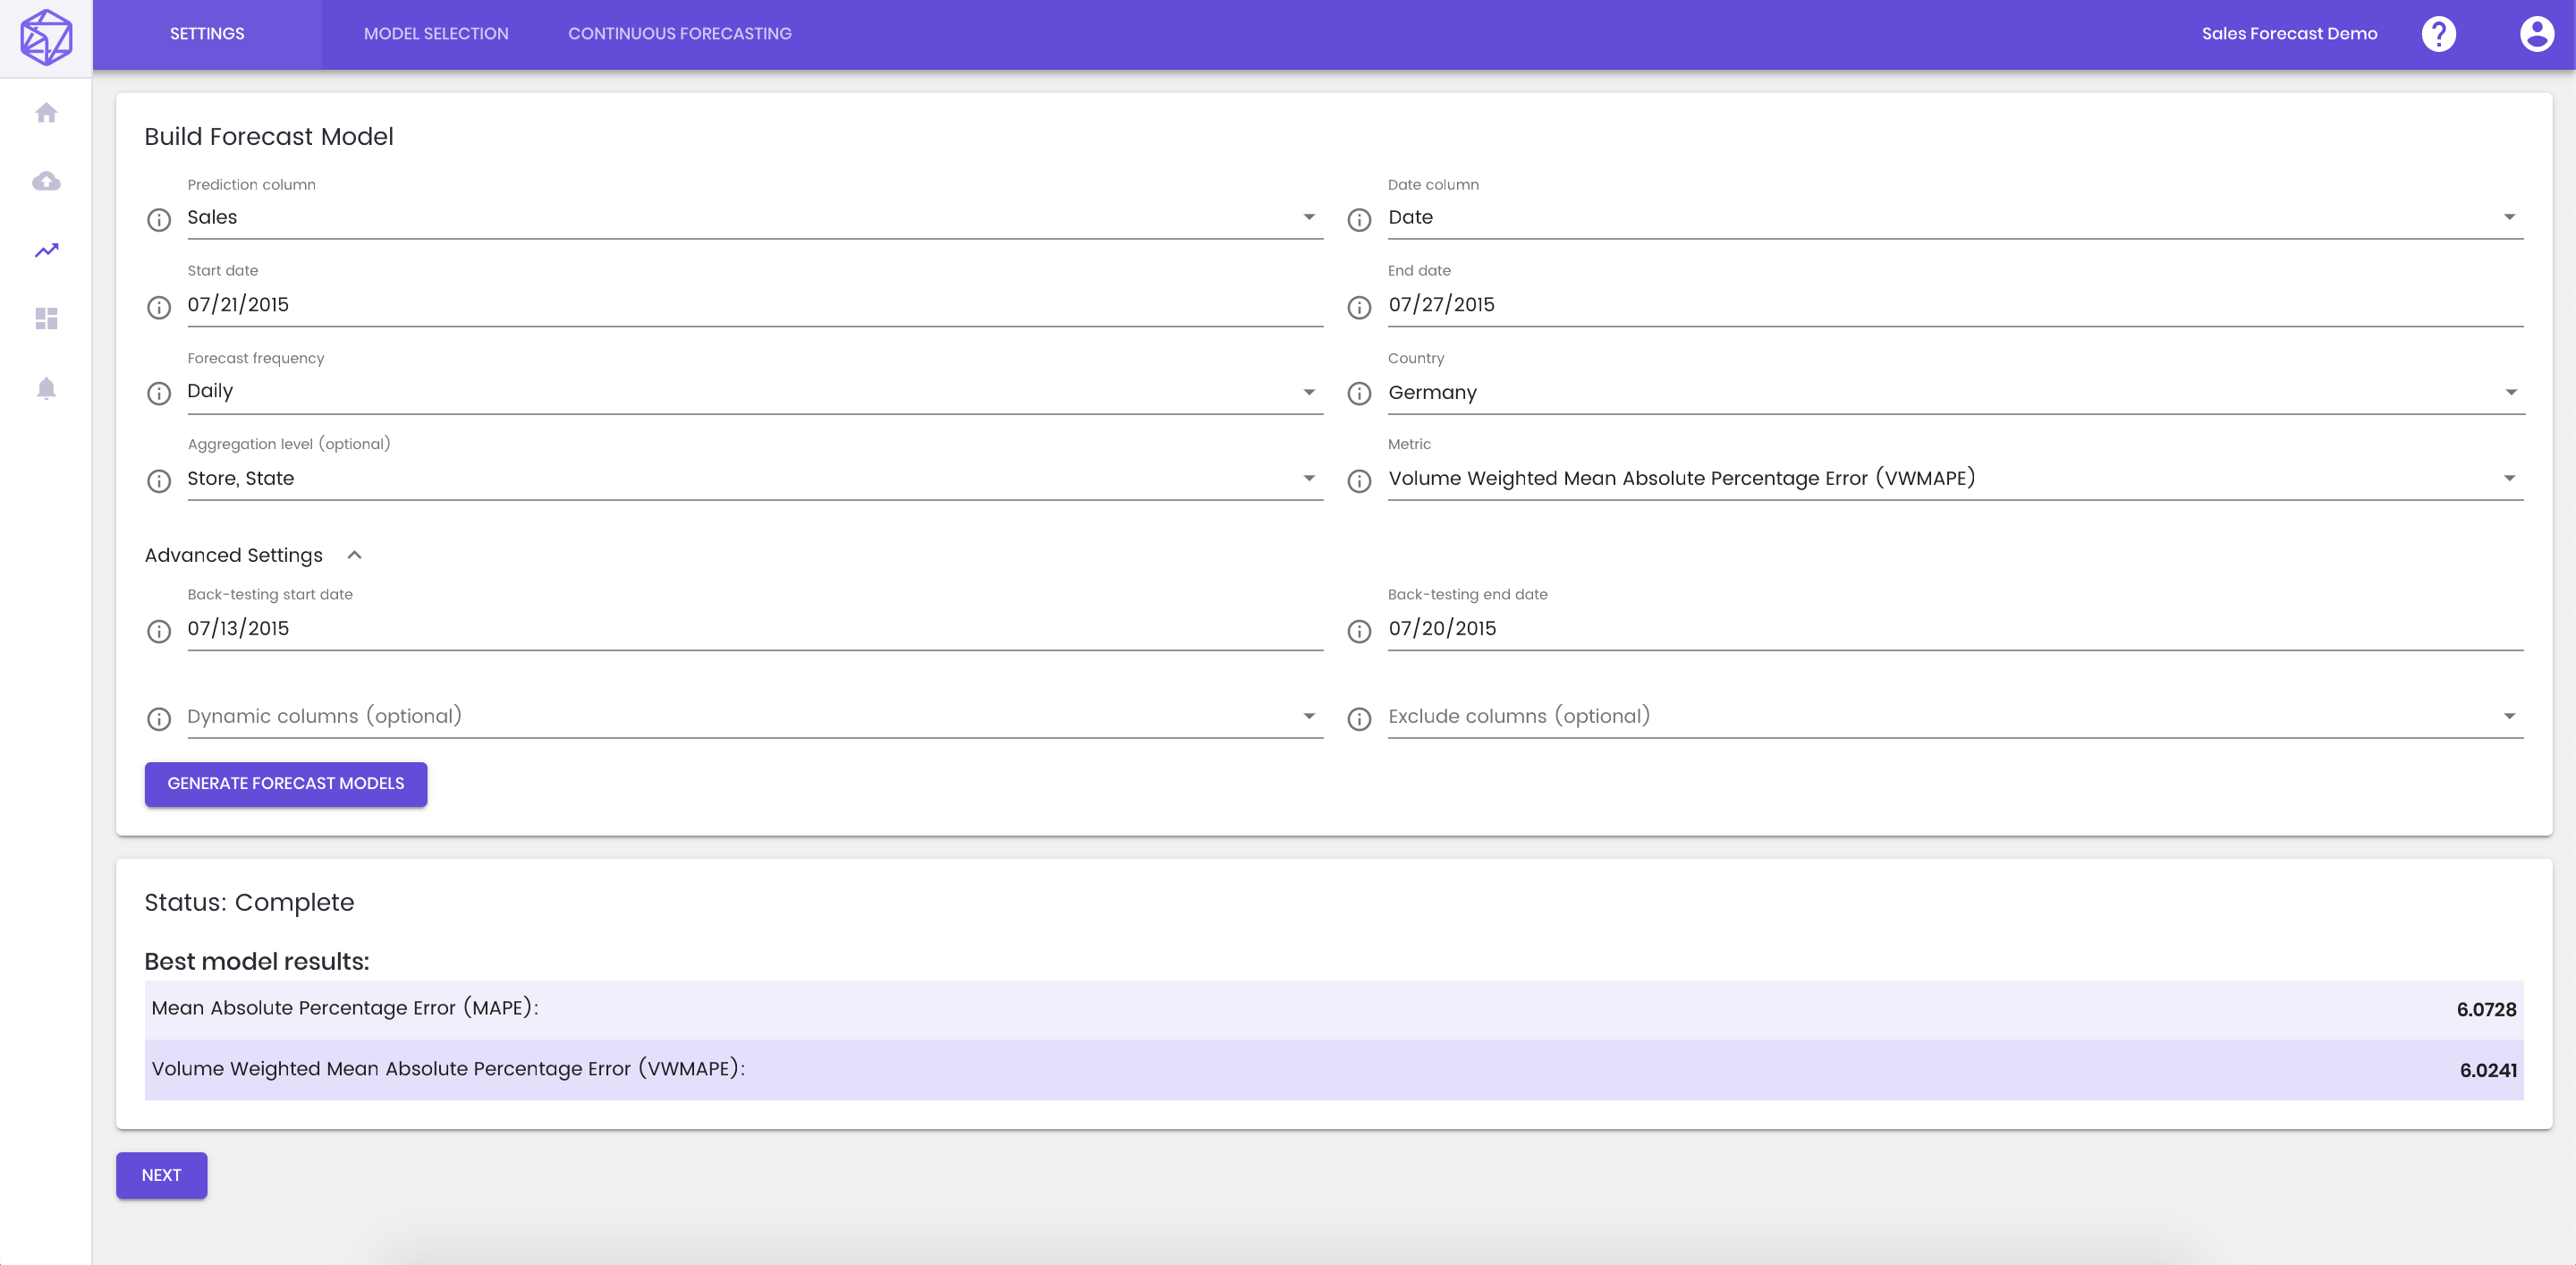
- Prediction Column: Choose the column in the data set that you would like to predict. In this example, we choose 'Sales'.
- Date column: Choose the column which contains the date.
- Start Date: The starting date of the forecast.
- End Date: The ending date of the forecast.
- Forecast Frequency: Select if this is monthly, weekly or daily forecast during the time-span defined above.
- Aggregation Level: This multi-selector defines the forecast granular level e.g if it is on State-Store, please select both.
- Metric: Metric is a mathematical formula that measures the accuracy of the forecasts. Mean absolute percentage error is the most common one.
Advanced Settings:
- Back-test Starting and Ending Date: You can specifically choose a time range in the past to test the consistency of the forecasting model. This time-span should be no shorter than the future forecast time-span.
- Dynamic Columns: It defines the dynamic factors that users can perceive ahead into the future - e.g., promotions, marketing campaign, holidays, weather and etc.
Step 5 - Select a Model for Future Continuous Forecast
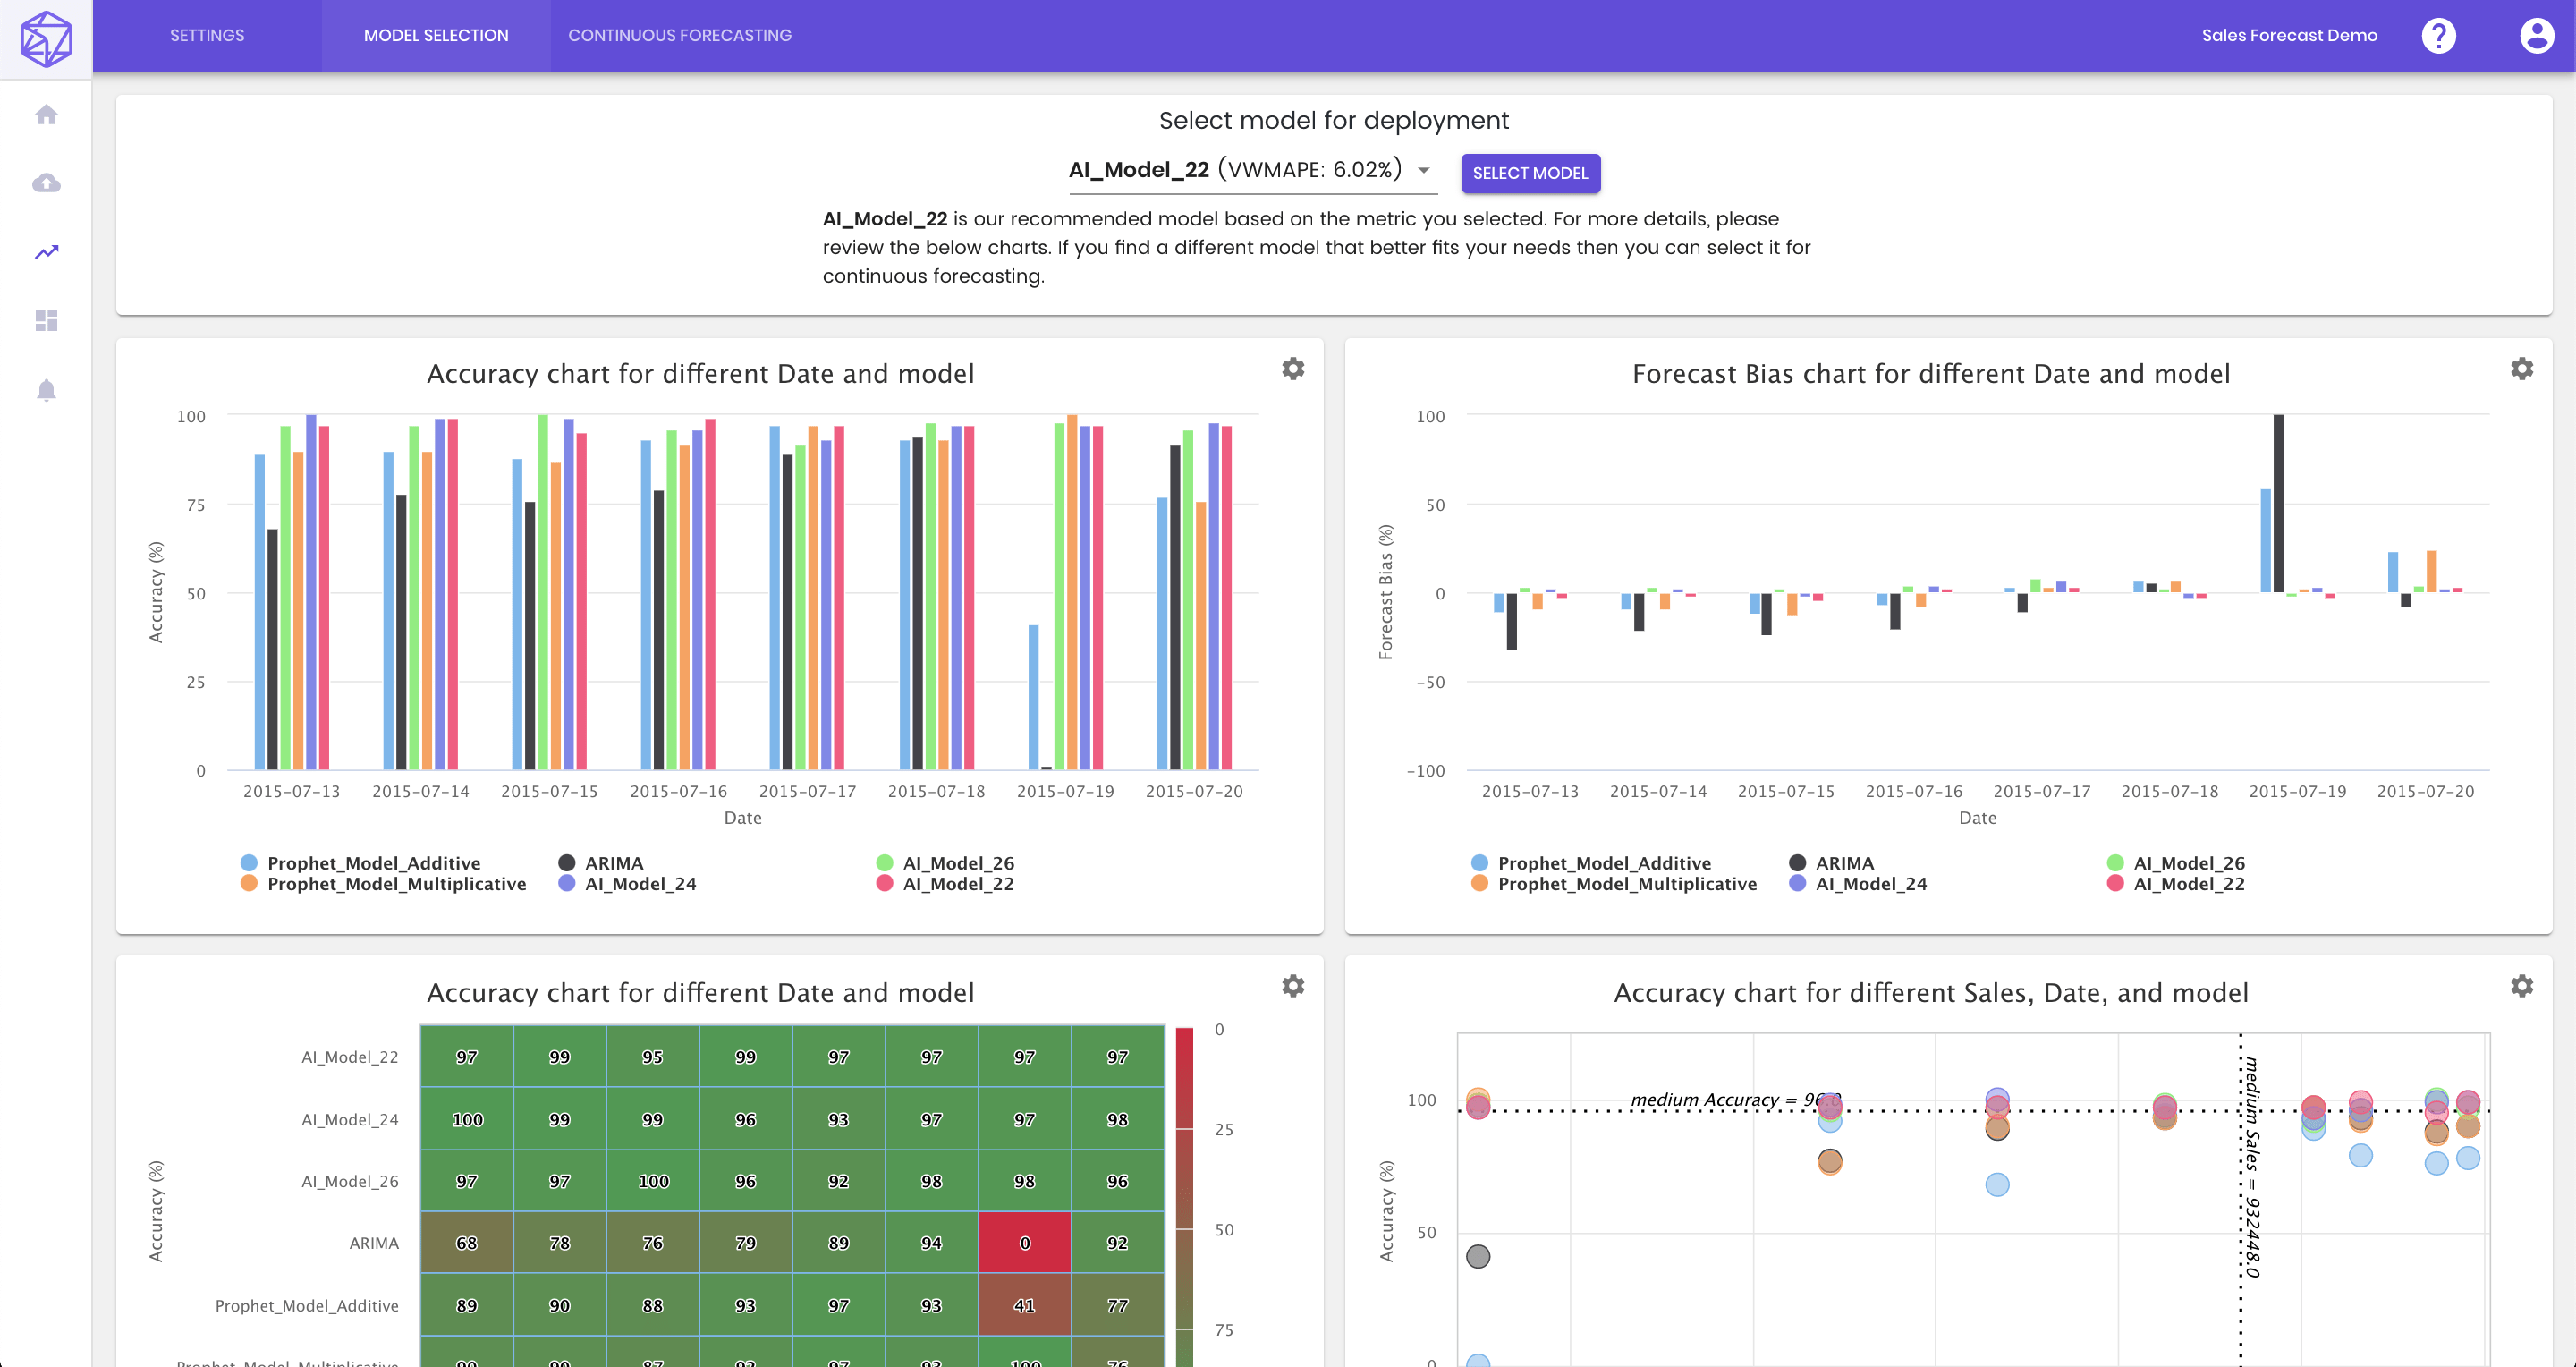
Under the hood, the platform automatically builds different AI forecasting models given the characteristics of your data and forecasting settings. At the same time, we also build statistical models like SARIMAX(seasonal ARIMA), Facebook Prophet as the baselines to compare their performance against more advanced AI forecasting models.
We select the best model automatically given the metric defined in the last step. You can also do additional analytics by slicing and dicing the data and choose another model to deploy.
There are 4 charts generated by default.
(1) Forecast accuracy over time and models: this chart shows the selected model's forecast accuracy (100 - abs(actual - forecast) * 100 / actual) performance over a pre-defined backtesting period. Not only we'd like to see the selected model has decent forecast accuracy, but also the model needs to be consistent over time.
(2) Forecast bias over time and models: this chart shows the selected model's forecast bias (100 * (actual - forecast) / actual) performance over a pre-defined backtesting period. If the forecast is perfect, there should be a horizontal line across 0.
(3) This is a different view of forecast accuracy over time and models, with dates as the x-axis and forecast accuracy as the y-axis.
(4) This chart derives from Boston Consulting Group's Matrix chart, with Sales as the x-axis, accuracy as the y-axis, models as different colors. Given 80-20 rules, what we'd like to see is that forecast accuracy is high on big sales SKUs, stores, or channels, while remaining good enough for long-tail ones.
All the charts are configurable by clicking on their top right corner.
Step 6 - Schedule the Time for Continuous Forecast (Optional)
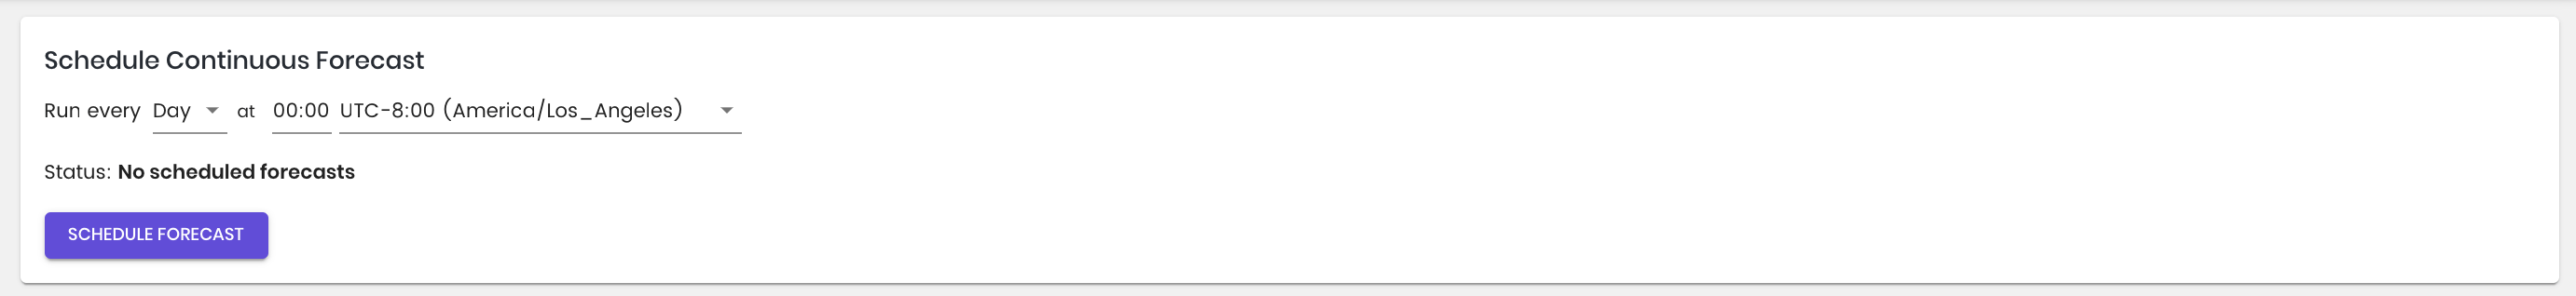
Once one forecast model is selected and it is ready to be deployed into the production system to do forecasting automatically as an ongoing basis. You can decide when the continuous forecast should be scheduled.
Click 'View Dashboard' to proceed.
Once one forecast model is selected and it is ready to be deployed into the production system to do forecasting automatically as an ongoing basis. You can decide when the continuous forecast should be scheduled.
Click 'View Dashboard' to proceed.
Step 7 - Upload Latest Data If Continuous Forecast is Scheduled, Skip This Step Otherwise
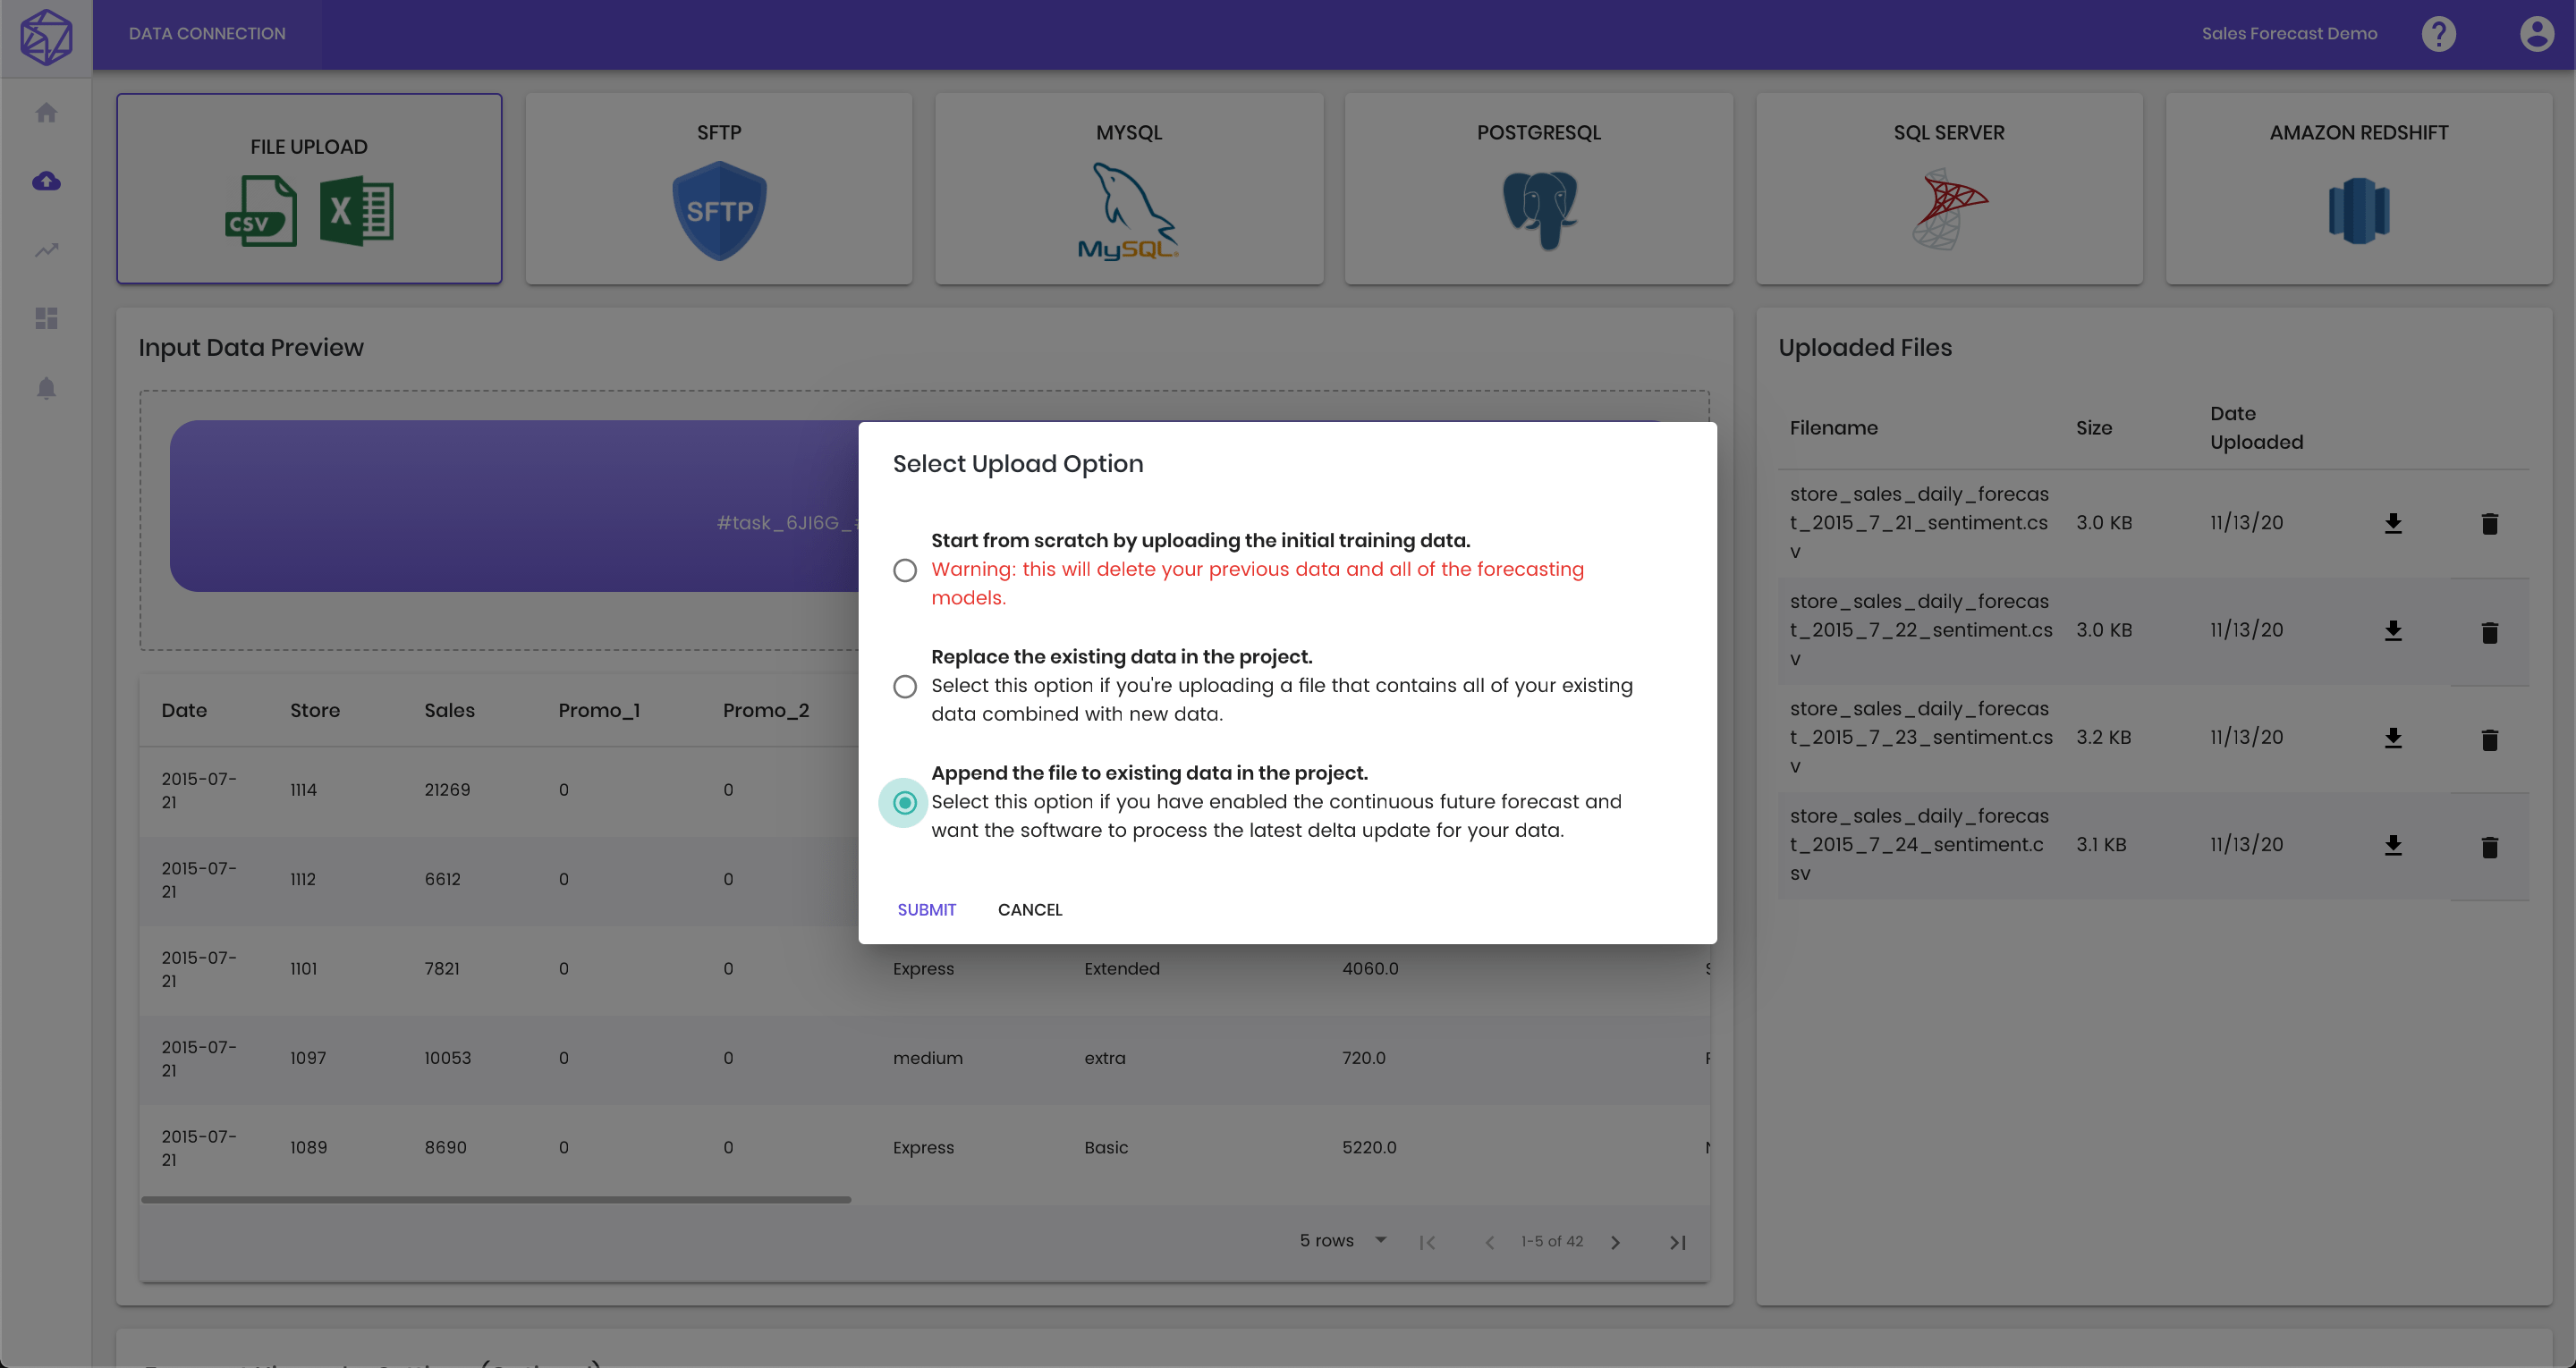
Once the continuous forecast is set up, let us say daily forecasting, the system will fetch the data automatically from the remote SQL database or FTP server at the scheduled time and generate the latest forecast.
If you are uploading the file manually, please make sure you do so before that scheduled time. There is no need to upload the entire history, daily delta change is enough. For instance, let us say the daily scheduled time is 10 am in the morning. You will need to upload only yesterday's transaction data to the system before 10 am on an ongoing basis. What happens at 10 am in the system is to combine all the uploaded data together, refresh the model, and generate new forecasts.
Step 8 - Pulse
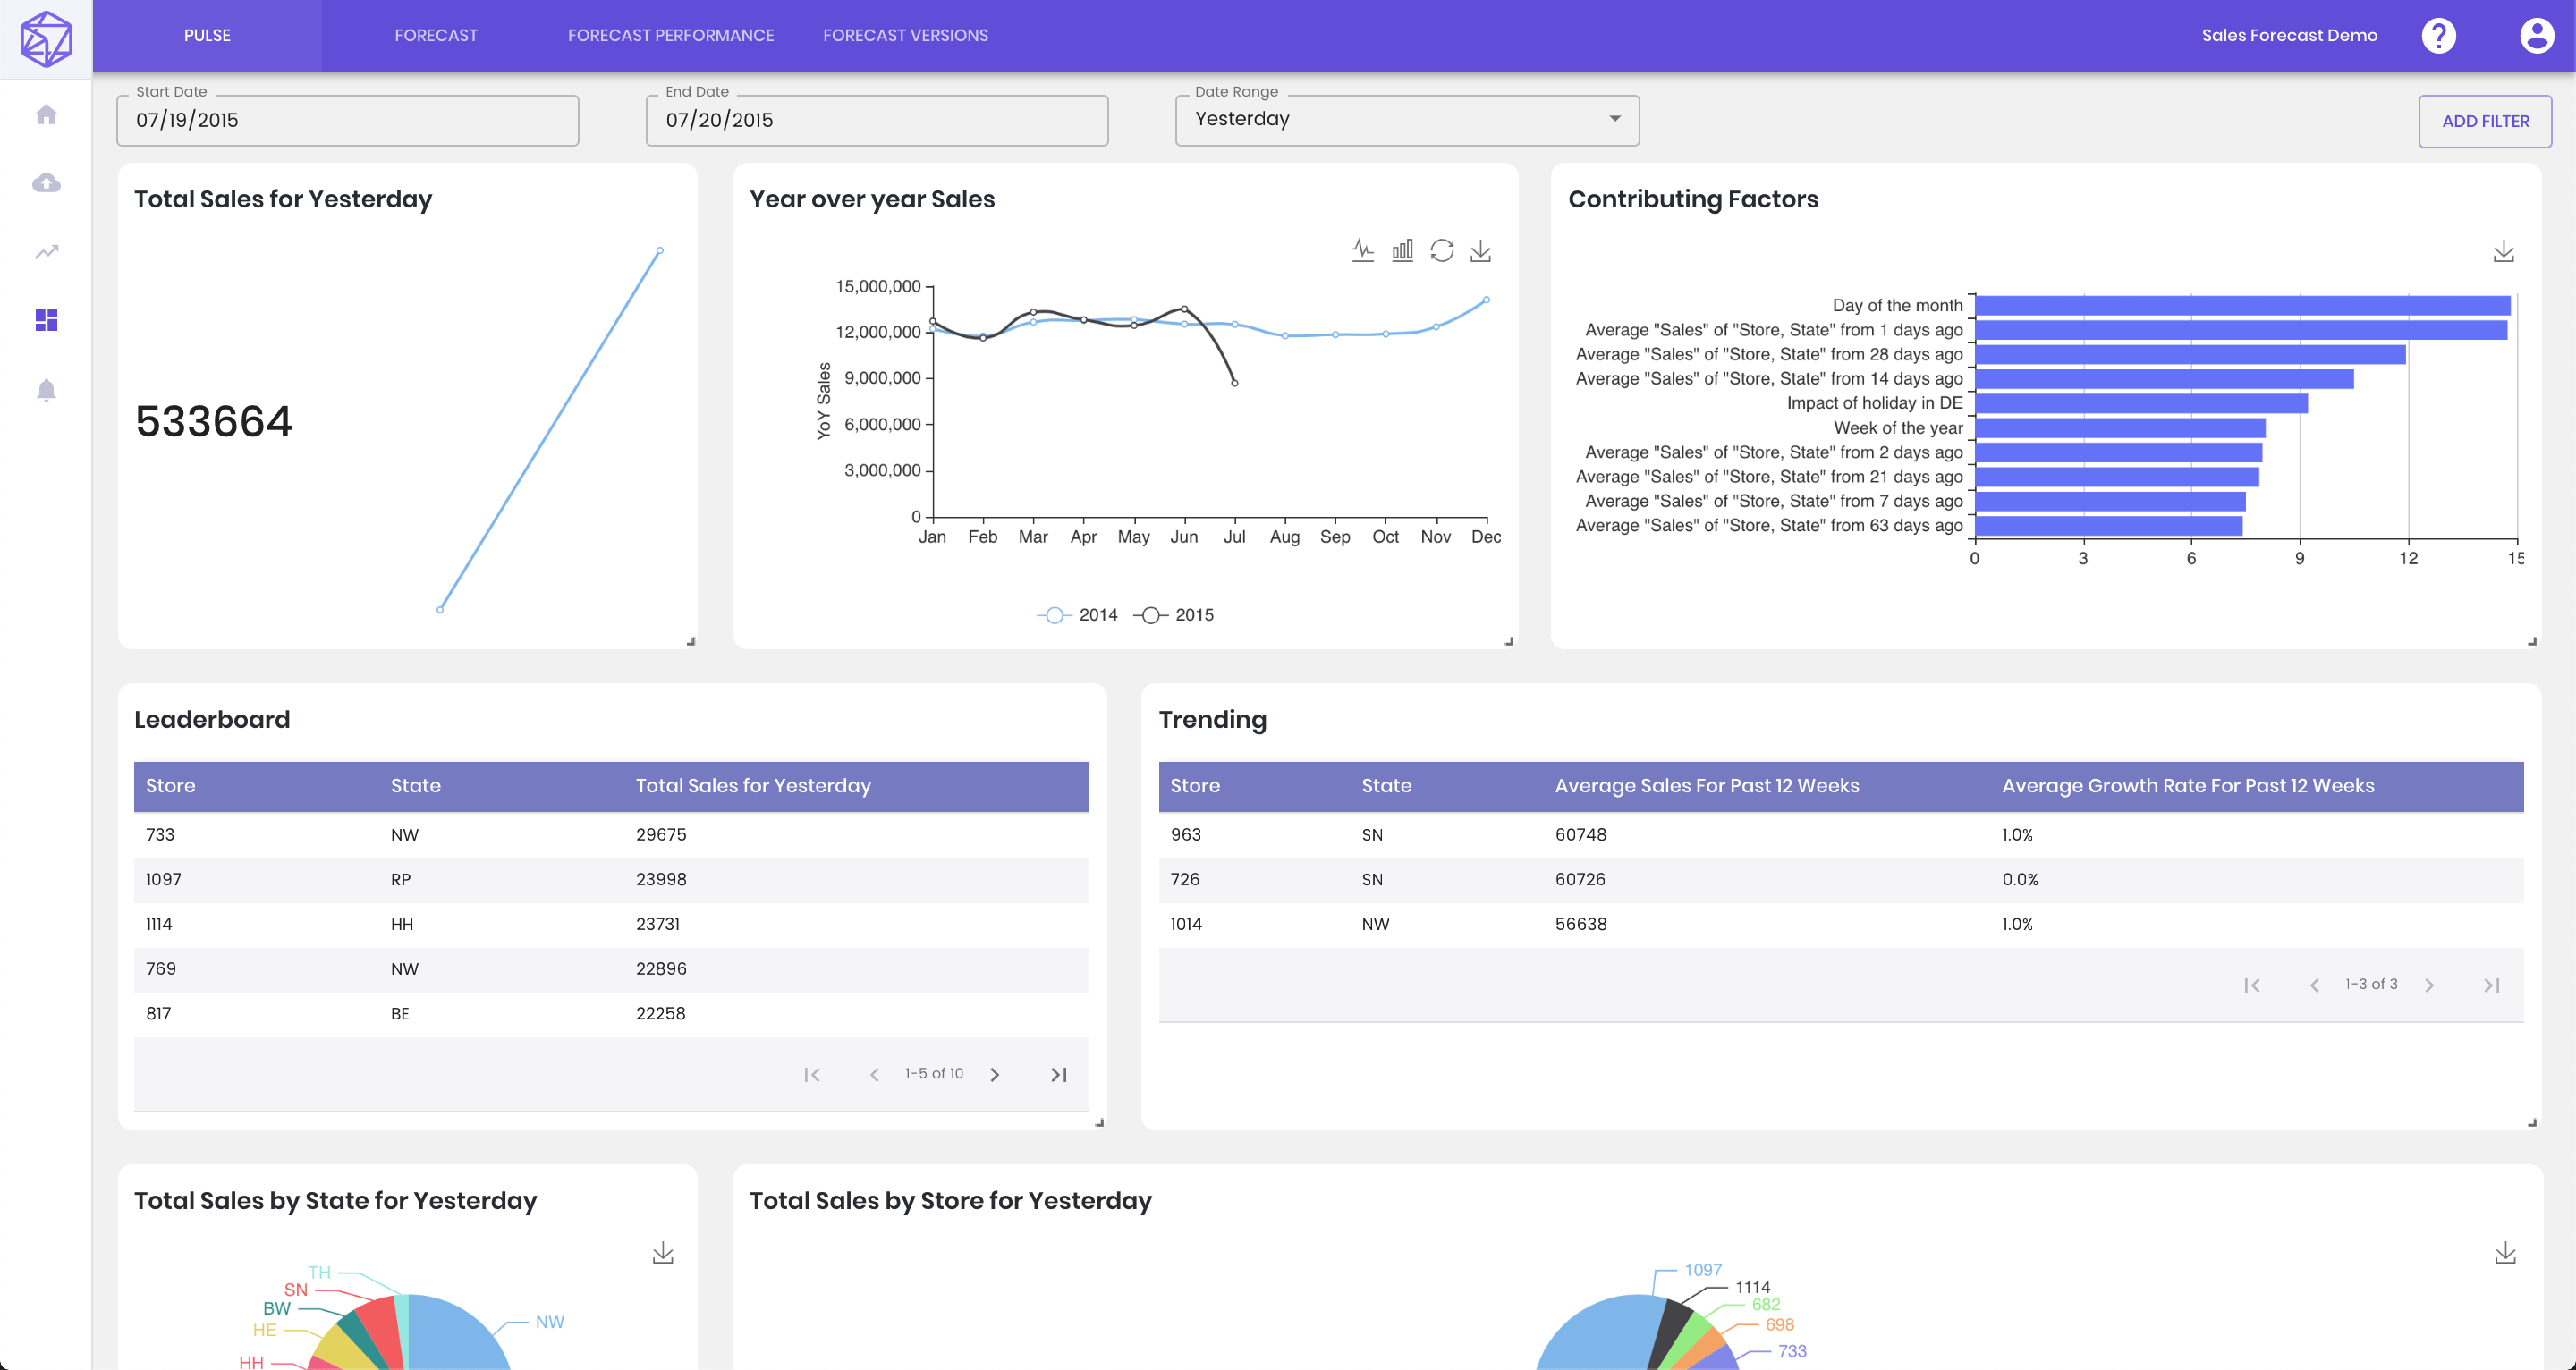
You can view both major KPIs on this dashboard, e.g Y-Y sales, a total of the forecasts, sales distribution across different segments.
There is also a chart, which illustrates the top driving factors that contribute the most to sales. This is mainly from AI modeling perspective and users can leverage this information to quantify the impacts from those factors, prepare additional data with this guidance. Furthermore, they can efficiently try more data sources to see if they help to improve the forecast performance.
Step 9 - Forecast Overrides
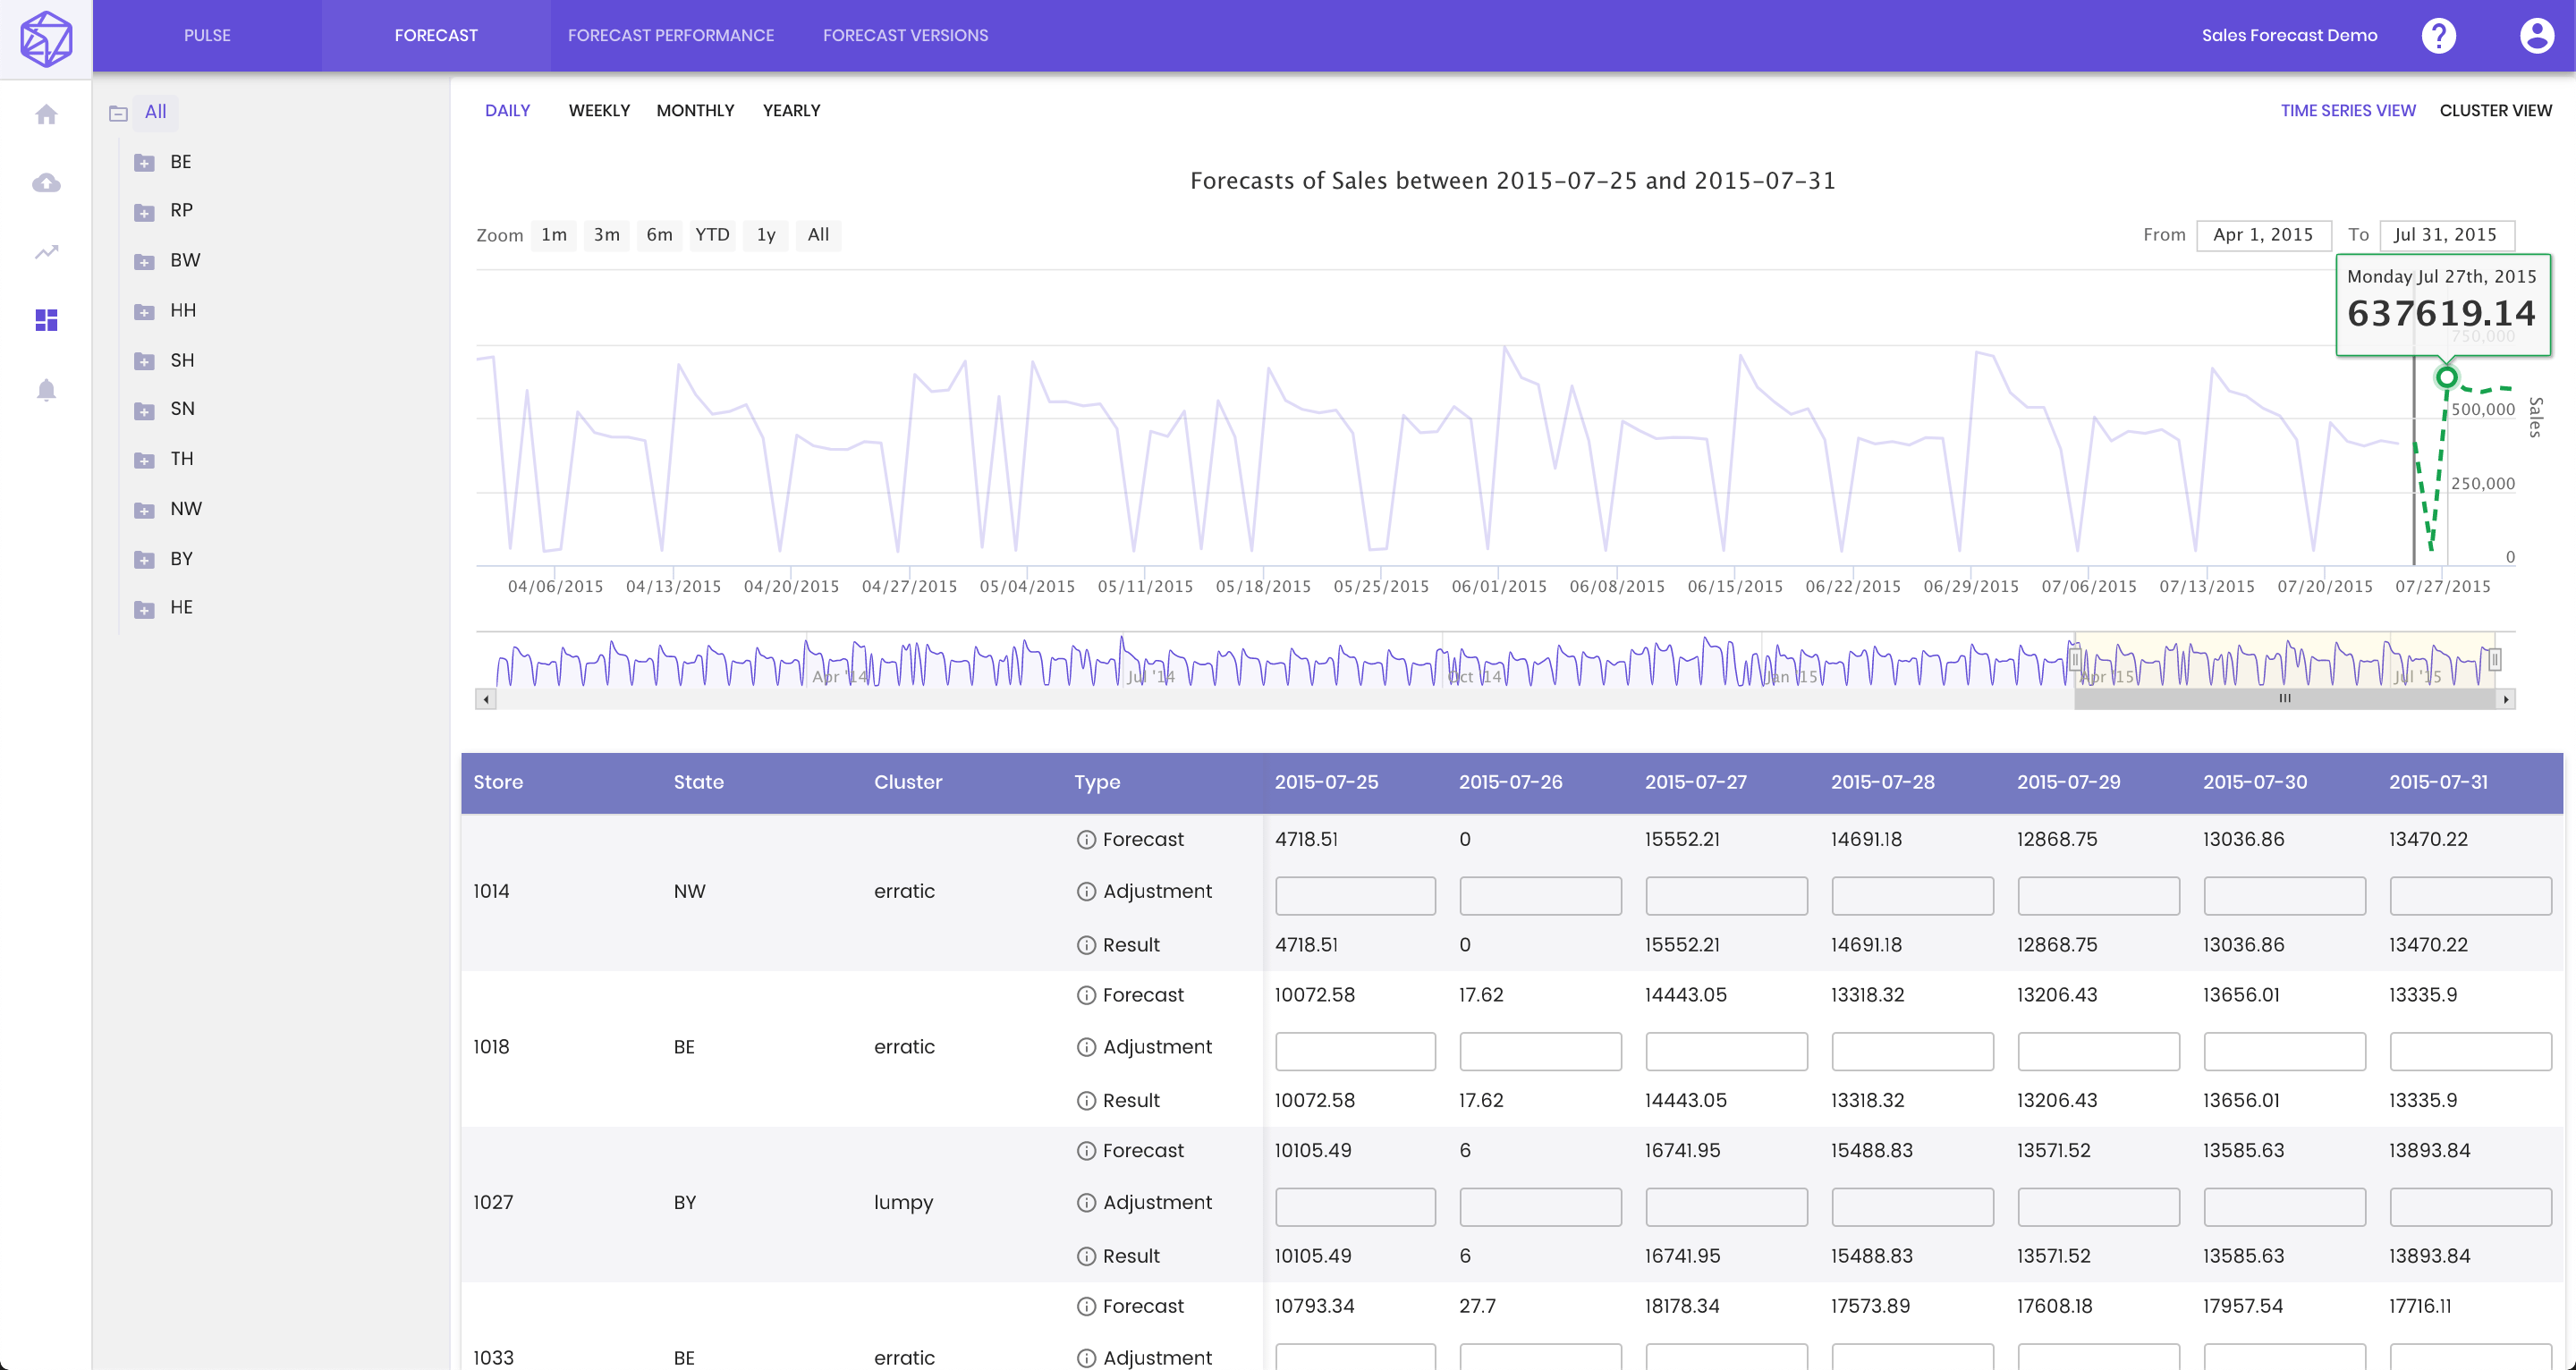
You can see all the forecasting results here and make any adjustment needed.
To override on the higher aggregation level, it is more convenient to drag the forecast to the desired value directly on the chart and the adjustments will be applied automatically to all the products within that aggregation.
You can also adjust at each individual level by manually input the new values or percentage change (+20%, -10%).
Step 10 - Forecast Performance
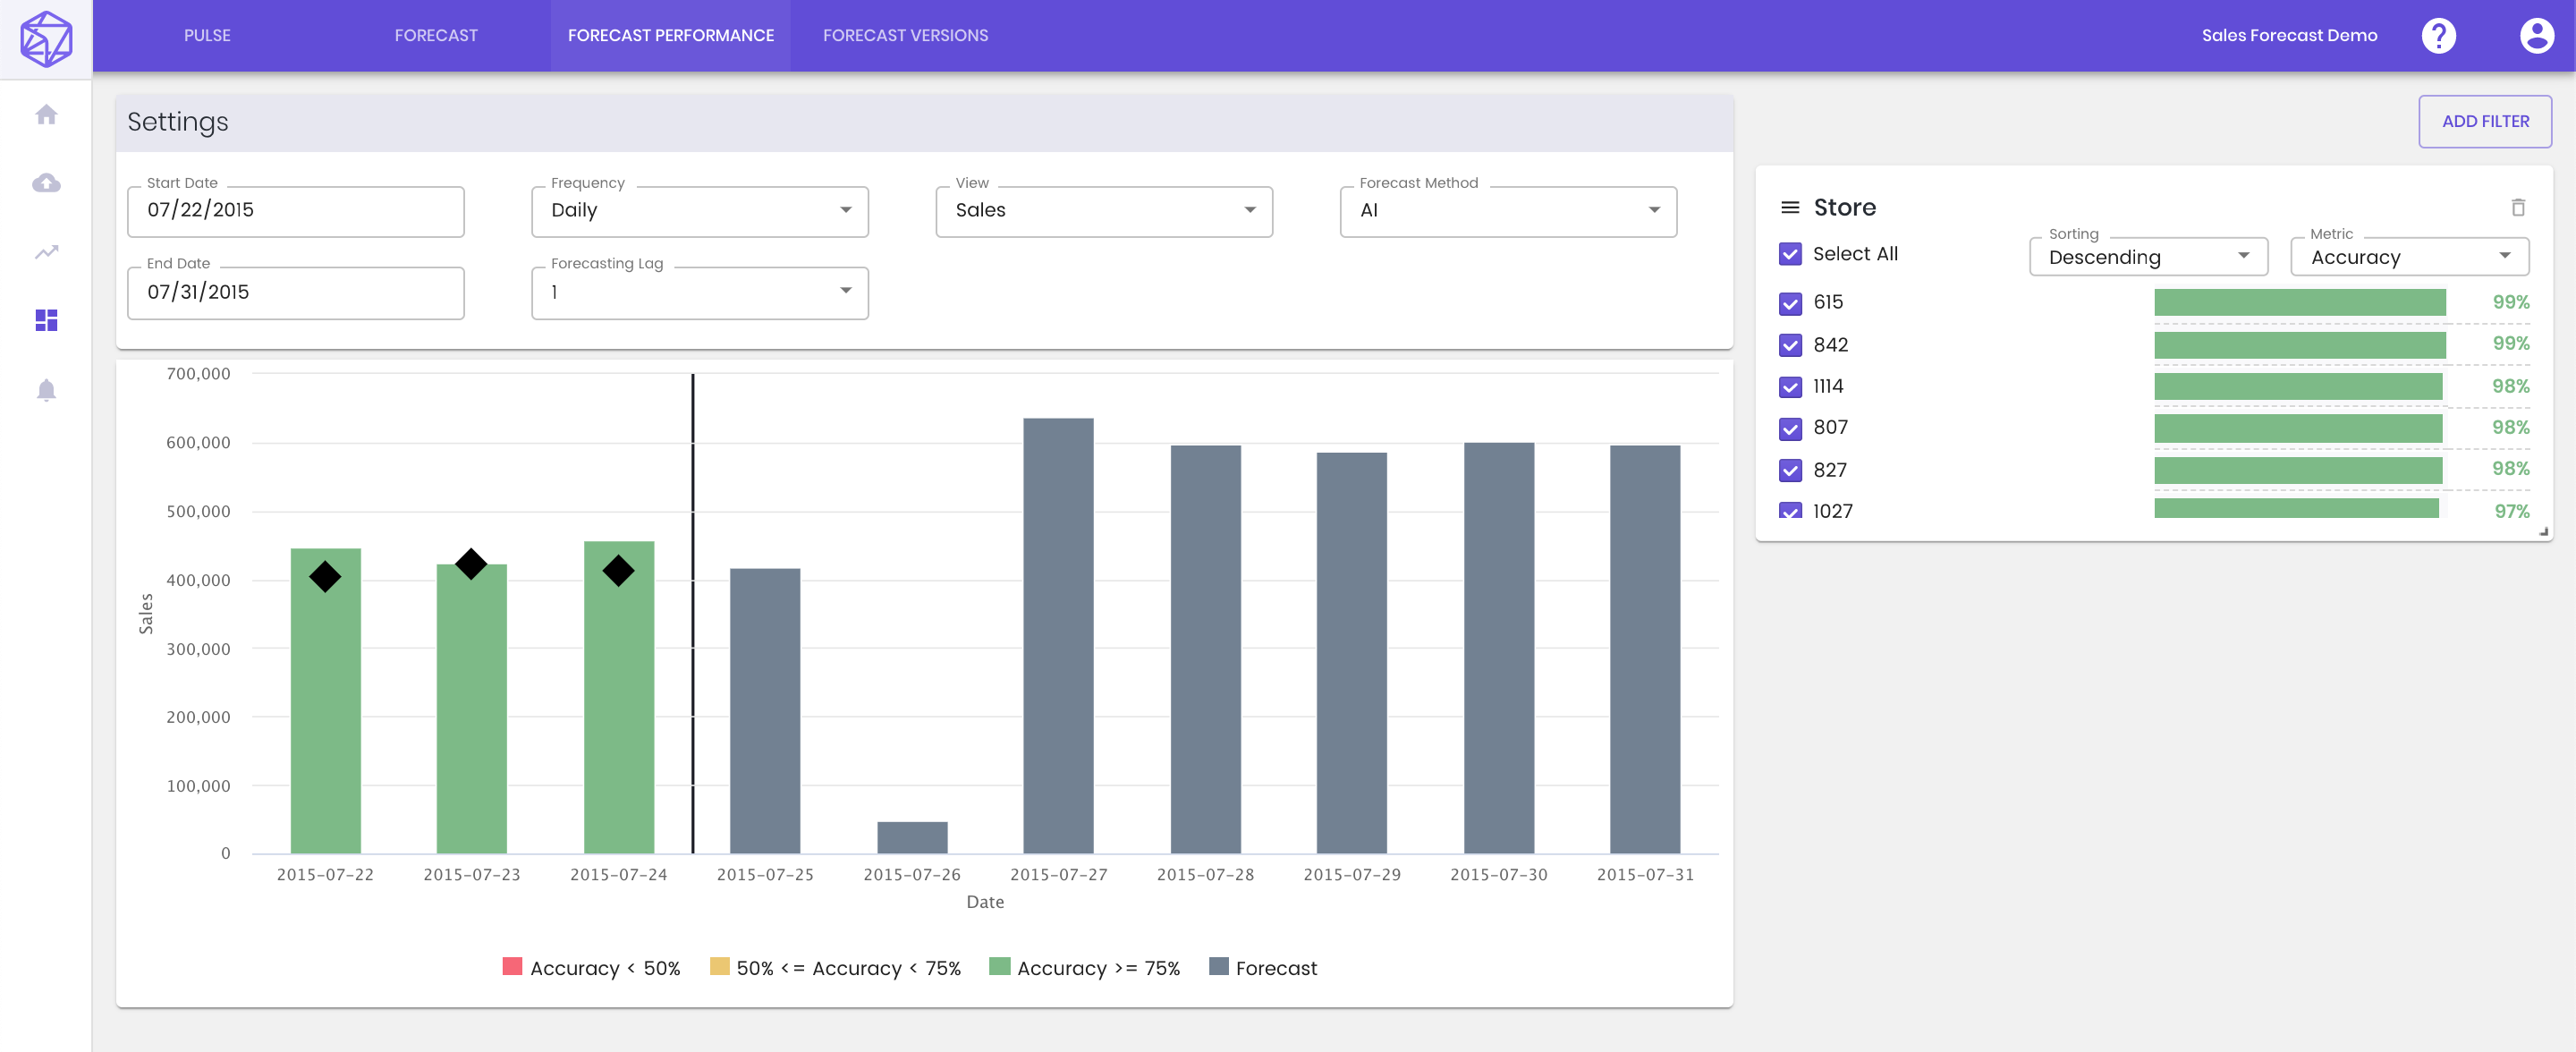
After the continuous forecast starts, the system will calculate the forecast accuracy, forecast deviation, and forecast achievement (forecast attainment) based on the updated actual sales and the forecast made by the model. The user can select any time interval and a specific Lag Forecast to view.
Start and end dates: pick a time range to view the difference.
Frequency: this defines the granular level of the visualization: daily, weekly or monthly.
View: user can pick the absolute difference between two forecast versions or the relative percentage change (100% * (version 2 - version 1) / version 2).
Forecast method: user can pick (1) only the AI forecast (2) AI forecast + manual overrides to compare two forecast versions.
Forecast lag: For example, if a user is doing monthly forecast, lag 1 means the forecast for the next month, and lag 2 means the forecast for the month after the next one.
Filters: slice and dice your data by selecting segments in the product, category, store, marketing channel and etc.
The left side of the dividing line in the figure is the comparison between the historical actual sales and the model's forecast/ The right side of the line is the most recent forecasts. You can add filters to limit the visualization on certain segments within your data. Furthermore, the color bar on each segment also displays how well the forecast is.
You can also select a different metric to display. They are: (1) Forecast accuracy: 100 - abs(actual - forecast) * 100 / actual (2) Forecast bias: 100 * (actual - forecast) / actual (3) Forecast attainment: total actual in the period / total forecast in the period
Step 11 - Forecast Versions
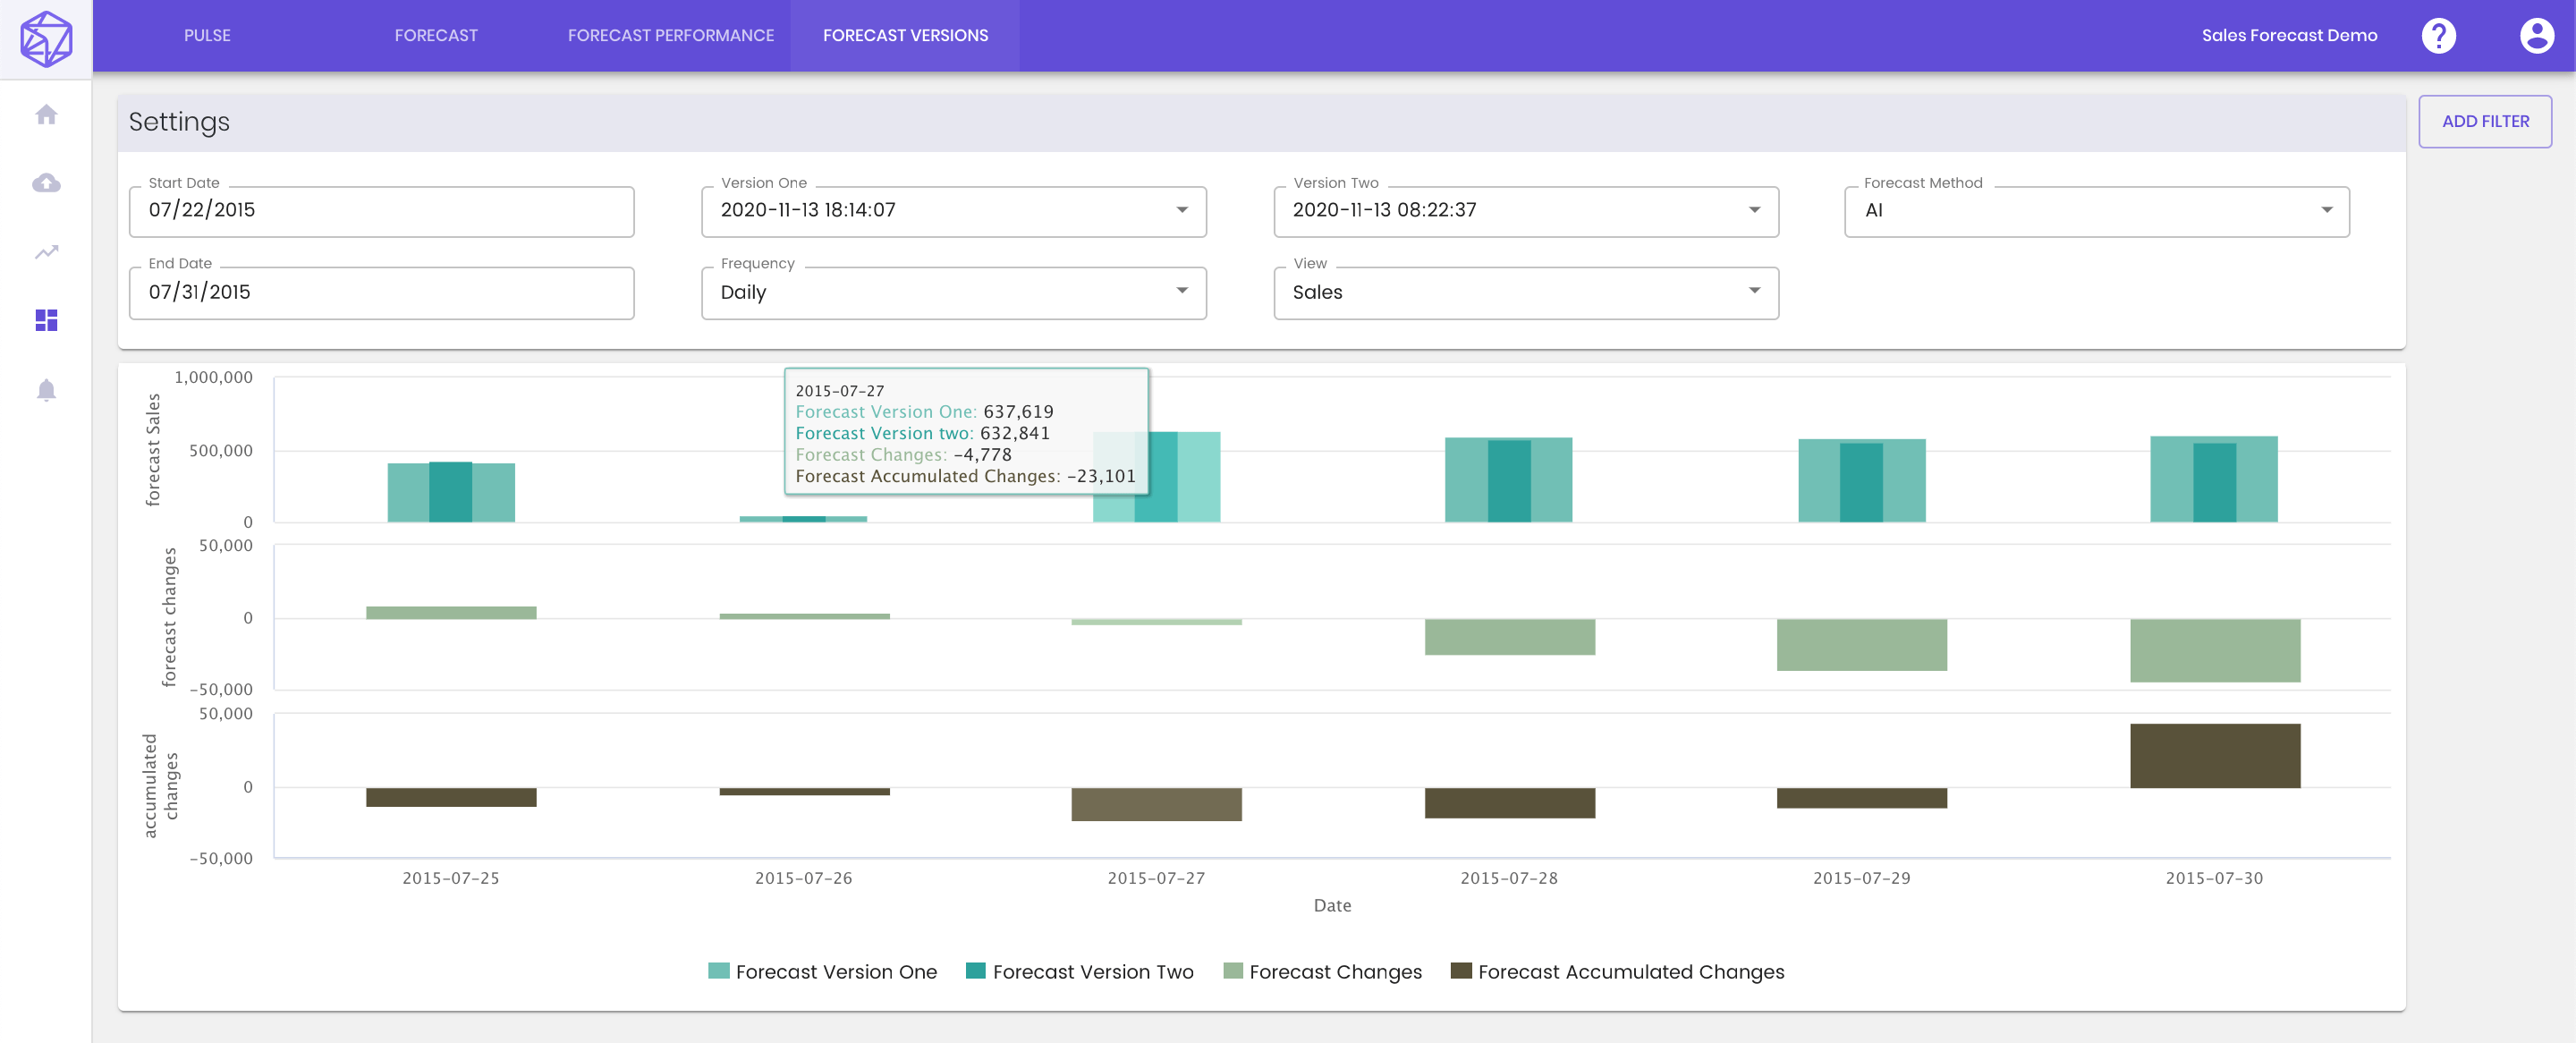
After the continuous forecast starts, users can view the changes between any two versions. Though we hope that the forecasts produced by different versions are close enough. In fact, there is always some difference due to that the data used to forecast are different, new patterns have occurred or others.
Start and end dates: pick a time range to view the difference.
Frequency: this defines the granular level of the visualization: daily, weekly or monthly.
View: user can pick the absolute difference between two forecast versions or the relative percentage change (100% * (version 2 - version 1) / version 2).
Forecast method: user can pick (1) only the AI forecast (2) AI forecast + manual overrides to compare two forecast versions.
Forecast versions: select any two versions in the past.
Filters: slice and dice your data by selecting segments in the product, category, store, marketing channel and etc.
There are 3 parts in the figure: (1) The top one represents the forecast values from two versions with different colors. The higher the bar, the bigger the forecast. (2) The middle one represents the percentage change between the two versions. (3) The bottom one represents the cumulative forecast change. For example, 2015-07-24 has been forecasted for 4 times: 100, 120, 130, and 80. cumulative forecast deviation is (120-100) + (130-100) + (80-100) = 30.
Step 12 - Automatic Alerting
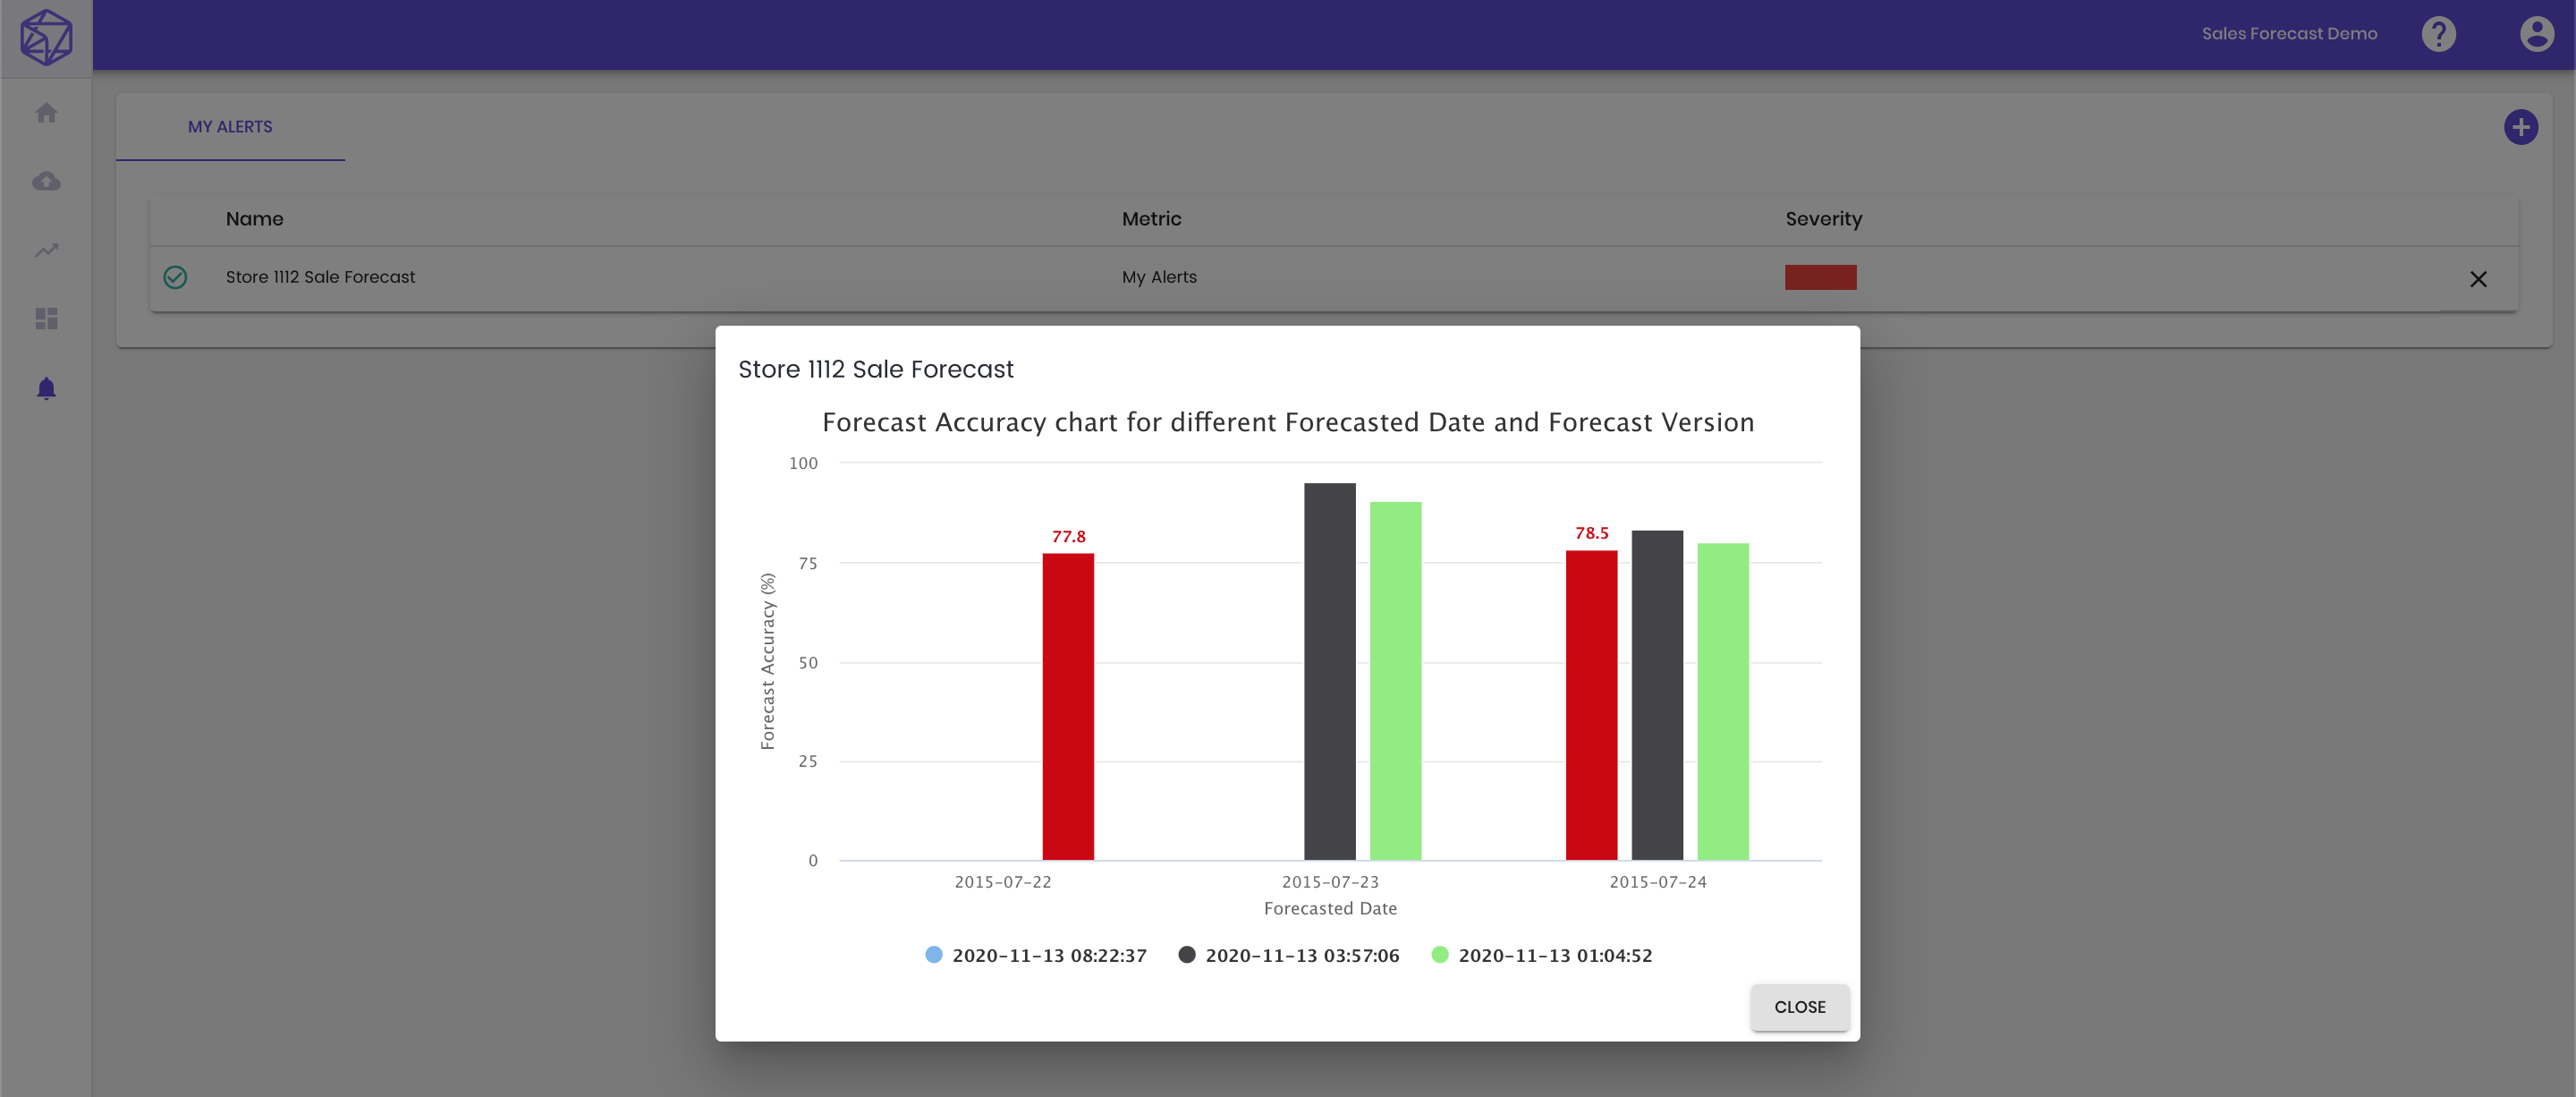
There are two ways users can be alerted by forecast outliers.
OneClick.ai can proactively push the alerts to users if it observes the forecast outliers within the data. The users can also setup their own alerts on this interface. For example, once the accuracy of the store 29 is lower than 80%, an alert is generated and an email is sent to the recipients . Users can define the name of the alert, the triggering condition, and the severity level of the alert. If you want to monitor a specific product or store, you can do so by defining the filtering conditions accordingly.
The users can click on any listed alert to view more details.
