
A contribution analysis is a way to analyze the effects of different options, programs, or policies on final outcomes. By predicting how much each program or action might contribute to a future outcome, a business or group can determine which program or action to use.
The process is typically performed by linear models due to their simplicity and ease in which they can be understood, but their simplicity is also their greatest weakness as they are too simple to achieve any high degree of accuracy.
This guide will cover an example of both the application of this task and a breakdown of how a contribution analysis works.
Example
An online dress retailer sells a wide range of dresses featuring different combinations of styles and dress features. They want to know what combination of features on a dress sells the best. To do this they need to look at how well dresses with different combinations of features have sold in the past. Then figure out which features (or combinations of ) led to the greatest sales. Our goals for this task are:
- Predict that outcome if a feature changes.
- Estimate the total sales if we do not have this feature.
- What if we have this feature on all these dresses?
- Differences between them, how much sales does this feature contributes?
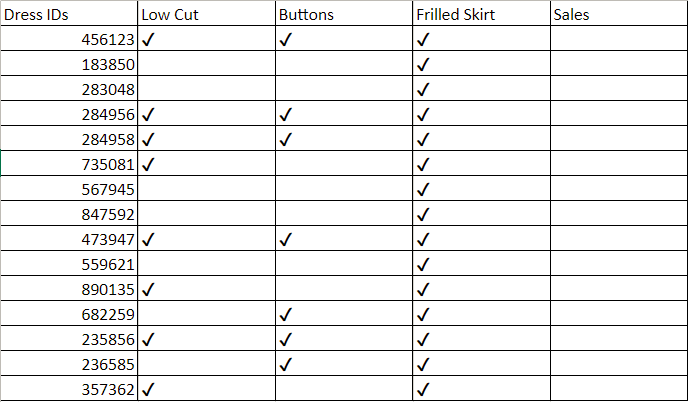
The training data table for this example will look something like this:
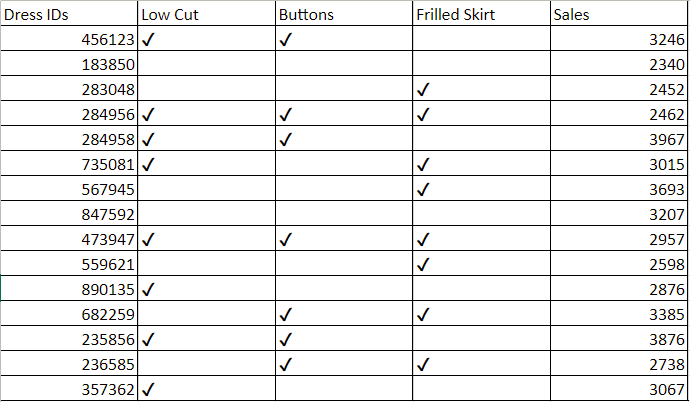
Here we have rows of different dresses, their respective sales, and the combination of dress features each dress has. With this data, we can begin to create a numeric prediction (regression) model to tell us which individual feature (or combination of) correlates with the best sales.
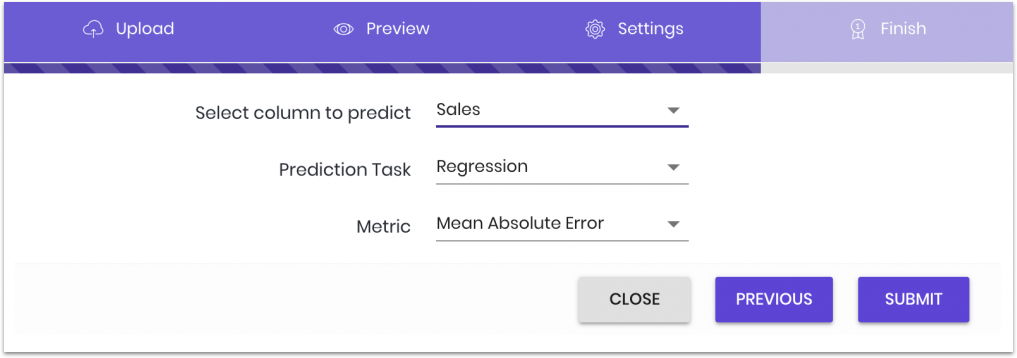
Building the model itself is simple, following the steps outlined in our walkthrough, the training data is converted to csv, uploaded, and the prediction task of regression is set with “sales” as our predicted column:
Counterfactual data constructions, and predictions
After the regression model is made it can now be used to do a contribution analysis.
To use the regression model for a contribution analysis, we need to construct the data to get specific information from our model. To do this we go back to our training dataset and clear out all values in the label. (all column names must stay exactly the same)
We then pick one column and clear it as well, until the dataset now looks like this:
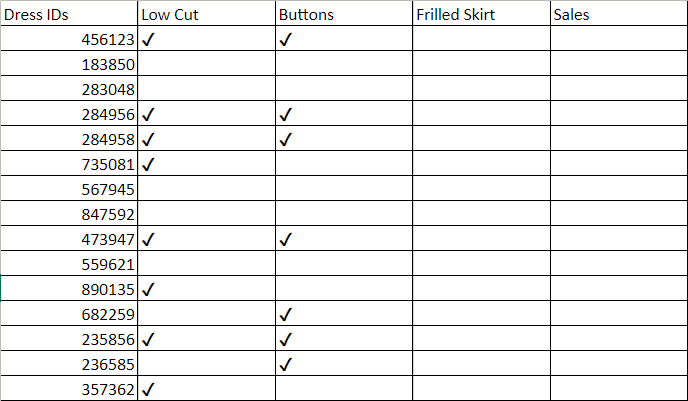
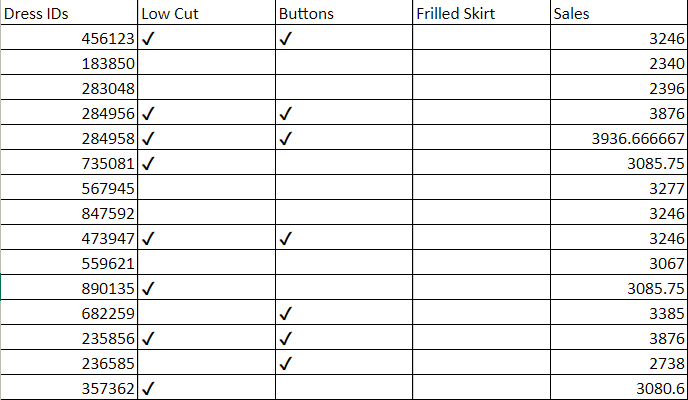
This new dataset can now be uploaded and our model can be applied to it. By removing all info from the label and column “Frilled Skirts”, the regression model will then tell us the predicted sales for our dresses if none of them had frilled skirts. Those sales predictions look like:
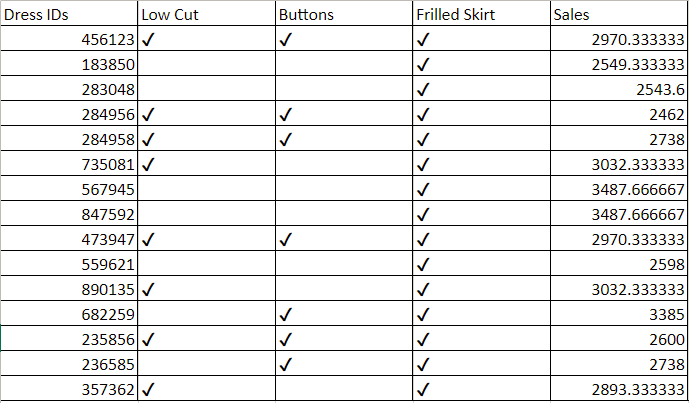
Now, go back and this time we will fill the “Frilled Skirts” column with checks (keep the label column blank):
We upload this dataset and apply our regression model to get predictions based on if every dress had frilled skirts:
The last step is to take the sums of total sales for each test:
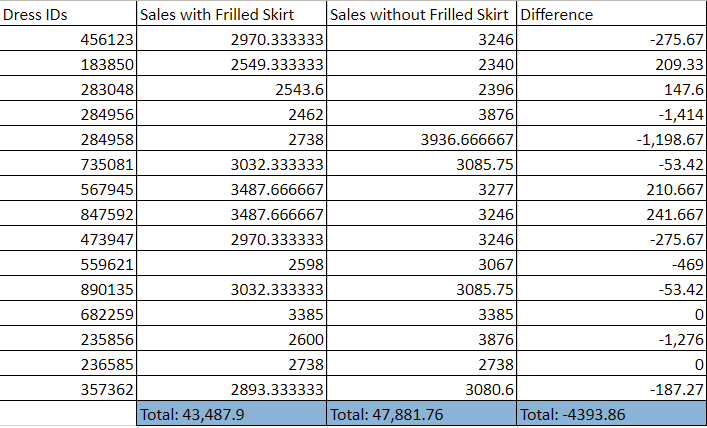
- All without Frilled Skirts, sales had a sum total of: 47,881.76
- All with Frilled Skirts, sales had a sum total of: 43,487.9
- If we calculate the difference, 43,487.9 – 47,881.76 = -4,393.86
We see that frilled skirts have a negative impact on dress sales, suggesting that we should not sell dresses with frilled skirts in the future, but by breaking it down by row we do see that some dresses sold positively when they only had frilled skirts, meaning that perhaps frilled skirts should simply not be used with any other dress feature.
These steps can be repeated for the dress features of “Buttons” and “Low Cut” to determine what impact they have.
OneClick.ai’s automated deep learning platform introduces a new way to perform contribution analysis by using non-linear models. Non-linear models offer two advantages over linear models. First, they are significantly more accurate than linear models. Second, they allow us to determine the contributions of feature combinations, determining how much groups of features contribute when used together, rather than alone. This novel approach of using non-linear modeling creates a highly accurate analysis as the foundation used to make the contribution analysis, the non-linear model, is more accurate.
Knowing the individual and combined contribution of each feature is paramount to smart decision making and program selection. OneClick.ai perfects this task by rejecting the traditional methods and choosing instead to innovate new ones. Our non-linear models provide unsurpassed accuracy and combination feature analysis, something no other platform can do. Any business or group can now easily identify poorly performing programs or actions to be cut, actions to be promoted, or how a combination of choices can produce the best result. OneClick.ai analyzes multiple competing or cooperating programs, and then provides an accurate contribution analysis that can tell any business exactly how well each program contributes.