
Numeric prediction, also known as Regression, predicts a numeric output value using training data. It is effectively used to predict a continuous numeric value, like price or cost.
In general, regression tasks are used to get information about certain aspects of a decision that will then inform a choice of action. An example of this is predicting the cost of a house, to then decide if it is worth buying.
Examples:
- Regression is used in the creation of trend lines, which uses past data to predict future performance or “trends.”
- Assessing the risk associated with investment vehicles. (predict costs of actions)
- Predict the demographics and types of future workforces for large companies.
Regression Example
To demonstrate the creation of a regression model we will be using the Boston housing dataset, modified slightly for clarity:
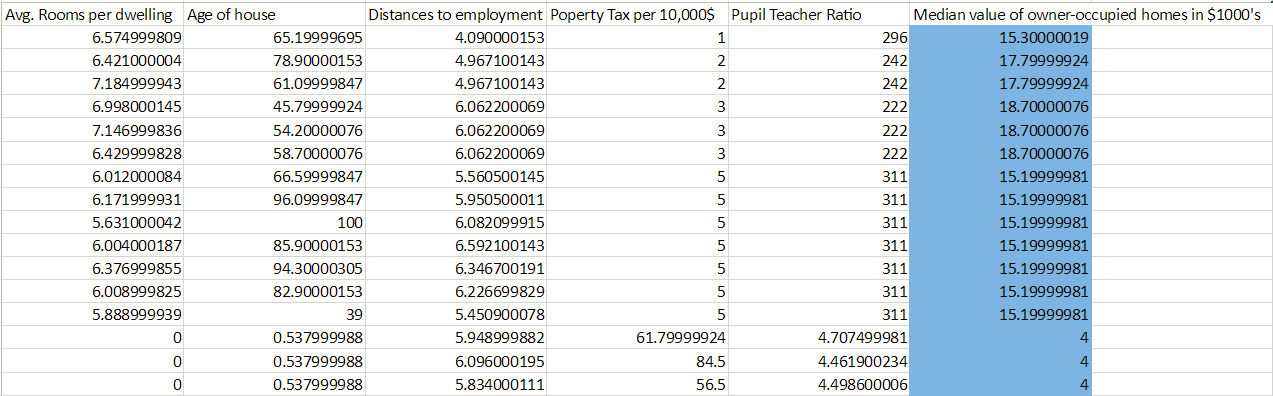
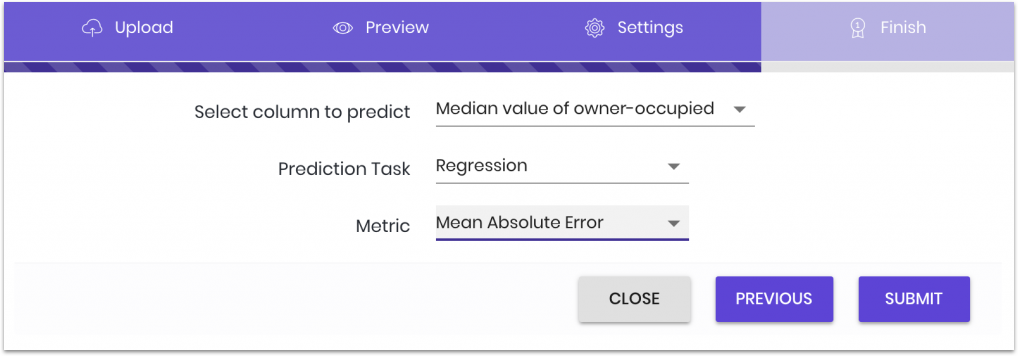
In this example, we are trying to predict housing values based on various factors (age of the house, property tax, number of rooms, etc.) We identify (shown in blue) that our label is the median housing value, additionally, we note that the data in the label are continuous numeric values. All this means that our prediction task should be Regression.
After uploading the data and selecting the task and label, we must choose a metric:
There are multiple metrics supported, it is important to choose the best metric that will help you evaluate the model in the real world.
Metrics
You must select a model most suitable for your application. We have defined three different metrics to help with that, those three metrics are calculated using a reserved 20% of the data submitted during training. That 20% is not used during the creation of the models and is only used later to determine the quality of created models.
The three supported metrics for regression tasks:
- MSE (Mean Square Error): the error is reported as the average of the squared differences between the difference and the truth.
- MAE (Mean Absolute Error): the error is reported as the average of the absolute differences between the difference and the truth.
- MAPE (Mean Absolute Percentage Error): the error is reported as a percentage of the absolute difference. The average of the absolute difference divided by the truth.
As a general rule, it is suggested that MAE should be the go-to metric for numeric prediction. This is primarily due to the fact that MAE is the easiest to interpret, avoids serious errors, and gives you a value closest to the truth.
MSE and MAPE serve unique functions that may make them the better choice for your metric. MSE is particularly sensitive to outliers due to it squaring the difference. This metric helps you find a model that is not skewed by outliers, as those that are penalized heavily and will not be shown.
MAPE is useful if the range of your data is particularly large and any attempt to get an actual numerical error would not be helpful. Useful if you want a relevant truth value that compensates for wildly different ranges.
Because each metric is reporting the amount of error, the lower the number reported the better the model. This is the opposite of accuracy.
When to use Regression over Classification
In a nutshell: you would use regression when you want to predict for continuous numerical data, like the price of a house, or the cost of a product. You would use classification only if you want to determine set classes or binary decisions like yes or no.
An issue that might come up is what to do for things like CTR (click through rate). While it might seem like CTR ptrfiv is a regression task as its output is a continuous number between 0 and 1, but it is actually a classification task. This is because the continuous number given is the probability of a binary choice (click or not click). Classification tasks give probability along with the predicted classes. As a general rule, whenever you want to predict probabilities go with classification.